empty
17.03.2023 12:12 PM
Technical analysis of EUR/USD for March 17, 2023

This image is no longer relevant

Overview :

The expected trend for today: Bullish.

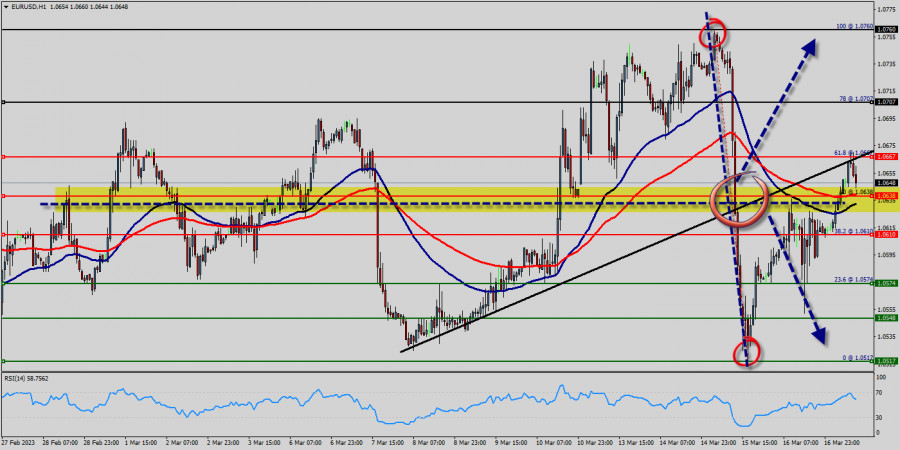
The EUR/USD pair rallied upwards strongly yesterday to breach the bearish channel's resistance and settles above it, opening the way to turn to the upside on the intraday and short-term basis, starting bullish correction for the raise measured from 1.0610 to 1.0707, noting that the first main station is located at 1.0638, which breaching it represents the key to achieve additional gains that reach 1.0638.

Therefore, the bullish bias will be suggested for today, supported by the EMA100 that carries the price from above, taking into consideration that breaking 1.0638 will stop the expected rise and push the price back to the main bearish track again.

A medium term topped could be in place already, on bullish convergence condition in daily RSI. Intraday bias is now on the upside for 50% retracement of 1.0638 to 1.0667 at 1.0707.

The EUR/USD pair traded higher and closed the day in the positive territory around 1.0638 - 1.0640.

On the hourly chart, EUR/USD is still trading above the moving average line MA (100) H1 (1.0638). Accordingly, the bullish outlook remains the same as long as the EMA 100 is pointing to the uptrend.

This suggests that the pair will probably go above the daily pivot point (1.0638) in the coming hours.

The EUR/USD pair will demonstrate strength following a breakout of the high at 1.0638. The situation is similar on the one-hour chart.

Based on the foregoing, it is probably worth sticking to the north direction in trading, and as long as the EUR/USD pair remains above MA100 H1, it may be necessary to look for entry points to buy for the formation of a correction.

Probably, the main scenario is continued growth towards 1.0707. The expected trading range for today is between 1.0638 support and 1.0707 resistance.

Chọn khung thời gian
5
phút
15
phút
30
phút
1
giờ
4
ngày
1
ngày
1
tuần
Kiếm lợi nhuận từ những biến đổi giá của tiền điện tử với InstaForex.
Tải MetaTrader 4 và mở giao dịch đầu tiên của bạn.
  • Grand Choice
    Contest by
    InstaForex
    InstaForex always strives to help you
    fulfill your biggest dreams.
    THAM GIA CUỘC THI

Các bài báo được đề xuất

Phân Tích Kỹ Thuật Về Biến Động Giá Của Công Cụ Hàng Hoá Bạc, Thứ Năm Ngày 24 Tháng 4, 2025.

Trên biểu đồ 4 giờ, công cụ hàng hóa Bạc thể hiện xu hướng đang mạnh lên, điều này được xác nhận bởi sự di chuyển của giá Bạc đang

Arief Makmur 06:18 2025-04-24 UTC+2

Phân Tích Kỹ Thuật Biến Động Giá Chỉ Số Nasdaq 100, Thứ Năm Ngày 24 Tháng 4, 2025.

Mặc dù trên biểu đồ 4 giờ, chỉ số Nasdaq 100 đang ở trạng thái Sideways, nhưng biên độ của thị trường khá rộng, cho thấy

Arief Makmur 06:18 2025-04-24 UTC+2

Tín hiệu giao dịch cho VÀNG (XAU/USD) từ ngày 23-25 tháng 4, 2025: bán dưới $3,333 (200 EMA - 6/8 Murray)

Kế hoạch giao dịch của chúng tôi trong vài giờ tới là bán vàng dưới mức $3,333, với các mục tiêu tại $3,313 và $3,291. Chúng

Dimitrios Zappas 14:31 2025-04-23 UTC+2

Phân Tích Kỹ Thuật Diễn Biến Giá Nội Ngày Cặp Tiền Tệ Chéo AUD/JPY, Thứ Tư, Ngày 23 Tháng 4, Năm 2025.

Với việc xuất hiện sự phân kỳ giữa chuyển động giá của cặp tiền chéo AUD/JPY với chỉ báo Stochastic Oscillator và chuyển động giá của AUD/JPY nằm trên đường

Arief Makmur 06:37 2025-04-23 UTC+2

Phân Tích Kỹ Thuật Biến Động Giá Trong Ngày Của Công Cụ Hàng Hóa Vàng, Thứ Tư, Ngày 23 Tháng 4 Năm 2025.

Nếu chúng ta nhìn vào biểu đồ 4 giờ, công cụ hàng hóa Vàng dường như vẫn đang di chuyển trong xu hướng Tăng, nhưng với sự xuất hiện

Arief Makmur 06:37 2025-04-23 UTC+2

Dự báo Forex 22/04/2025: EUR/USD, GBP/USD, USD/JPY và Bitcoin

Liên kết hữu ích: Các bài viết khác của tôi có sẵn trong phần này Khóa học InstaForex cho người mới bắt đầu Phân Tích Phổ Biến Mở tài khoản

Sebastian Seliga 10:08 2025-04-22 UTC+2

Phân Tích Kỹ Thuật Biến Động Giá Trong Ngày của Cặp Tiền Tệ Chéo GBP/CHF, Thứ Ba Ngày 22 Tháng 4, 2025.

Nếu chúng ta nhìn vào biểu đồ 4 giờ của cặp tiền tệ GBP/CHF, có một số điểm thú vị. Đầu tiên, sự hiện diện của mẫu hình Tam giác

Arief Makmur 06:58 2025-04-22 UTC+2

Phân Tích Kỹ Thuật Chuyển Động Giá Nội Ngày của Cặp Tiền Tệ Chéo AUD/CAD, Thứ Ba, ngày 22 tháng Tư, 2025.

Với sự biến động giá của cặp tiền tệ chéo AUD/CAD di chuyển trên đường WMA (21) đang có xu hướng đi lên và sự xuất hiện

Arief Makmur 06:58 2025-04-22 UTC+2

Tín hiệu giao dịch cho VÀNG (XAU/USD) từ ngày 21-25 tháng 4, 2025: bán dưới $3,422 (quá mua - 8/8 Murray)

Chỉ báo đại bàng đã đạt đến mức quá mua. Tuy nhiên, kim loại này vẫn có thể đạt mức cao xung quanh 8/8 Murray, đây là một ngưỡng

Dimitrios Zappas 17:23 2025-04-21 UTC+2

Phân Tích Kỹ Thuật Sự Biến Động Giá Trong Ngày Cặp Tiền Tệ Chéo EUR/GBP, Thứ Hai Ngày 21 Tháng 4 Năm 2025

Nhìn từ biểu đồ 4 giờ, cặp tiền tệ chéo EUR/GBP dường như đang di chuyển trên EMA (100), điều này cho thấy rằng Người mua đang chiếm

Arief Makmur 04:19 2025-04-21 UTC+2
Không thể nói chuyện ngay bây giờ?
Đặt câu hỏi của bạn trong phần trò chuyện.
Widget callback
 

Dear visitor,

Your IP address shows that you are currently located in the USA. If you are a resident of the United States, you are prohibited from using the services of InstaFintech Group including online trading, online transfers, deposit/withdrawal of funds, etc.

If you think you are seeing this message by mistake and your location is not the US, kindly proceed to the website. Otherwise, you must leave the website in order to comply with government restrictions.

Why does your IP address show your location as the USA?

  • - you are using a VPN provided by a hosting company based in the United States;
  • - your IP does not have proper WHOIS records;
  • - an error occurred in the WHOIS geolocation database.

Please confirm whether you are a US resident or not by clicking the relevant button below. If you choose the wrong option, being a US resident, you will not be able to open an account with InstaForex anyway.

We are sorry for any inconvenience caused by this message.