signal strength 1 of 5
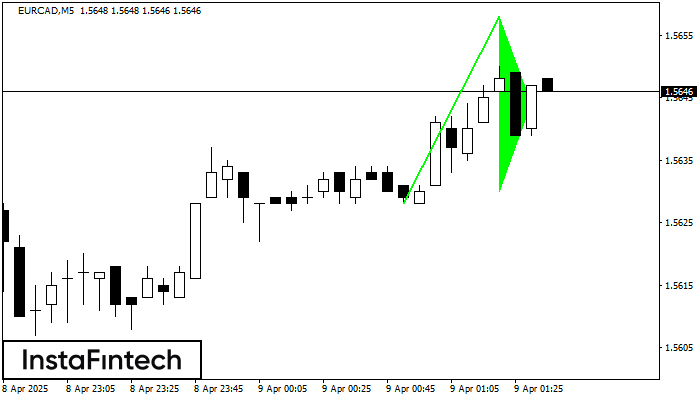
The Bullish pennant graphic pattern has formed on the EURCAD M5 instrument. This pattern type falls under the category of continuation patterns. In this case, if the quote can breaks out high, is expected to continue the upward trend to level 1.5673.
The M5 and M15 time frames may have more false entry points.
Veja também
- All
- Double Top
- Flag
- Head and Shoulders
- Pennant
- Rectangle
- Triangle
- Triple top
- All
- #AAPL
- #AMZN
- #Bitcoin
- #EBAY
- #FB
- #GOOG
- #INTC
- #KO
- #MA
- #MCD
- #MSFT
- #NTDOY
- #PEP
- #TSLA
- #TWTR
- AUDCAD
- AUDCHF
- AUDJPY
- AUDUSD
- EURCAD
- EURCHF
- EURGBP
- EURJPY
- EURNZD
- EURRUB
- EURUSD
- GBPAUD
- GBPCHF
- GBPJPY
- GBPUSD
- GOLD
- NZDCAD
- NZDCHF
- NZDJPY
- NZDUSD
- SILVER
- USDCAD
- USDCHF
- USDJPY
- USDRUB
- All
- M5
- M15
- M30
- H1
- D1
- All
- Buy
- Sale
- All
- 1
- 2
- 3
- 4
- 5
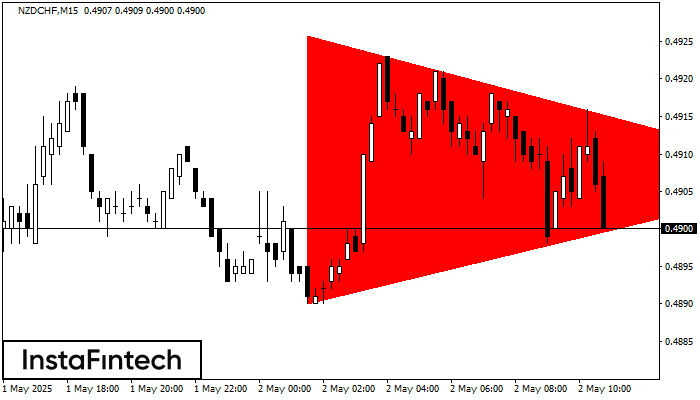
De acordo com o gráfico de M15, NZDCHF formou o padrão Triângulo Simétrico de Baixa. Descrição: o limite inferior é 0.4890/0.4907 e o limite superior é 0.4926/0.4907. A largura
Os intervalos M5 e M15 podem ter mais pontos de entrada falsos.
Open chart in a new window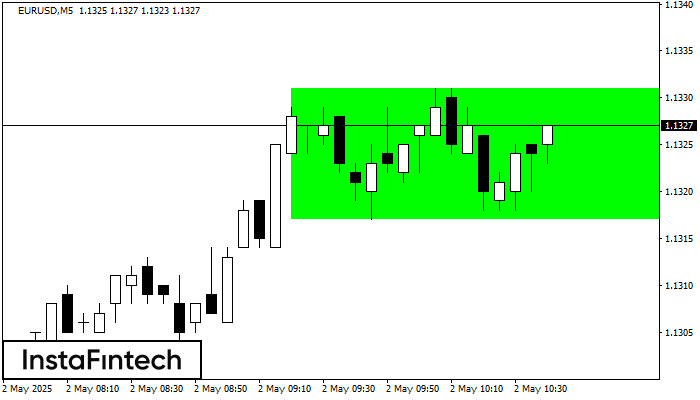
De acordo com o gráfico de M5, EURUSD formou Retângulo de alta. O padrão indica uma continuação da tendência. O limite superior é 1.1331, o limite inferior é 1.1317
Os intervalos M5 e M15 podem ter mais pontos de entrada falsos.
Open chart in a new window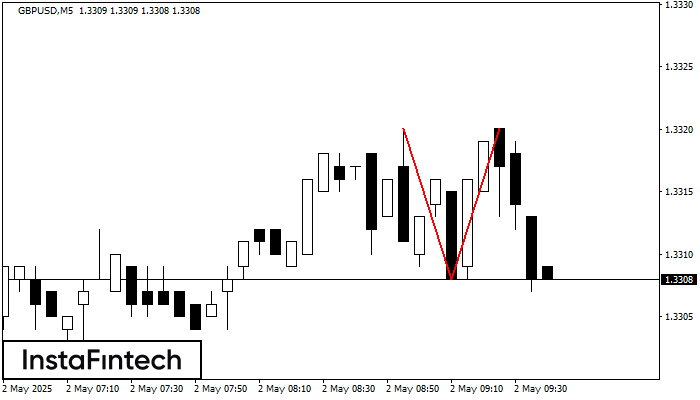
O padrão de reversão Topo duplo foi formado em GBPUSD M5. Características: o limite superior 1.3320; o limite inferior 1.3308; a largura do padrão é de 12 pontos. As operações
Os intervalos M5 e M15 podem ter mais pontos de entrada falsos.
Open chart in a new window