empty
18.03.2025 11:30 AM
EUR/USD – March 18th: Christine Lagarde Warns the U.S.

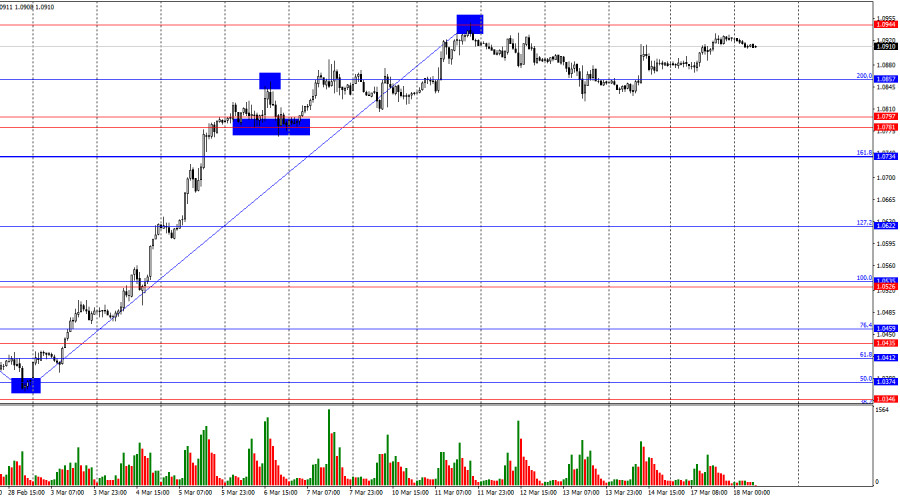
On Monday, the EUR/USD pair once again moved toward the 1.0944 level, but this time, bulls failed to reach this target. As a result, no new trading signals were generated. At the moment, the pair is fluctuating between 1.0857 and 1.0944, with low market activity. A rejection from 1.0944 would favor the U.S. dollar, potentially triggering a decline toward the 200.0% Fibonacci level at 1.0857.

This image is no longer relevant

The wave pattern on the hourly chart has shifted. The last completed downward wave broke the previous low, while the last upward wave surpassed the previous peak, indicating a bullish trend. However, the current rally appears impulsive, as bulls are driven by fears of a U.S. economic slowdown caused by Donald Trump's policies. This factor has been one of the main reasons for the U.S. dollar's recent decline.

Monday's fundamental backdrop was mixed. The only notable U.S. report—retail sales for February—rose by just 0.2%, falling short of market expectations. This prevented bears from gaining control once again. Meanwhile, ECB President Christine Lagarde issued a warning about the consequences of the U.S. trade war.

According to Lagarde, the trade war will cause greater damage to the U.S. than to other countries. She stated that many affected nations are already working on retaliatory tariffs and engaging in negotiations to avoid further escalation. However, Lagarde remains pessimistic, believing that global trade conflicts will harm all economies, slow global growth, and fuel inflation—with America suffering the most.

The market seems to share this view, as dollar bulls are absent. This week's FOMC meeting could influence sentiment, but I doubt it will be a positive catalyst for the U.S. dollar.

This image is no longer relevant

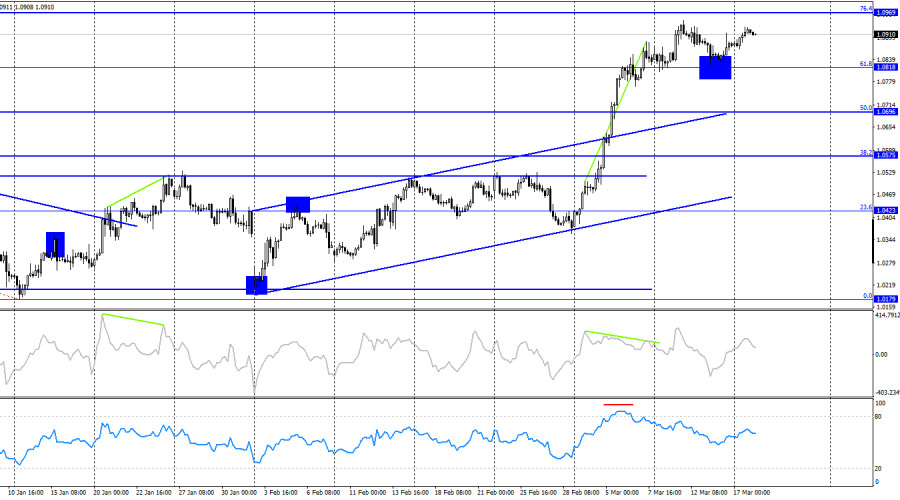
On the 4-hour chart, the bullish trend remains intact following a breakout above the horizontal range. The rising trend channel confirms this momentum. A rebound from the 61.8% Fibonacci level at 1.0818 suggests a potential move toward the next Fibonacci retracement at 1.0969.

Despite this, bearish divergence on the CCI indicator and RSI overbought conditions continue to signal a possible correction, though bears have not acted yet. A break below 1.0818 would open the door for a decline toward 1.0696.

Commitments of Traders (COT) Report

This image is no longer relevant

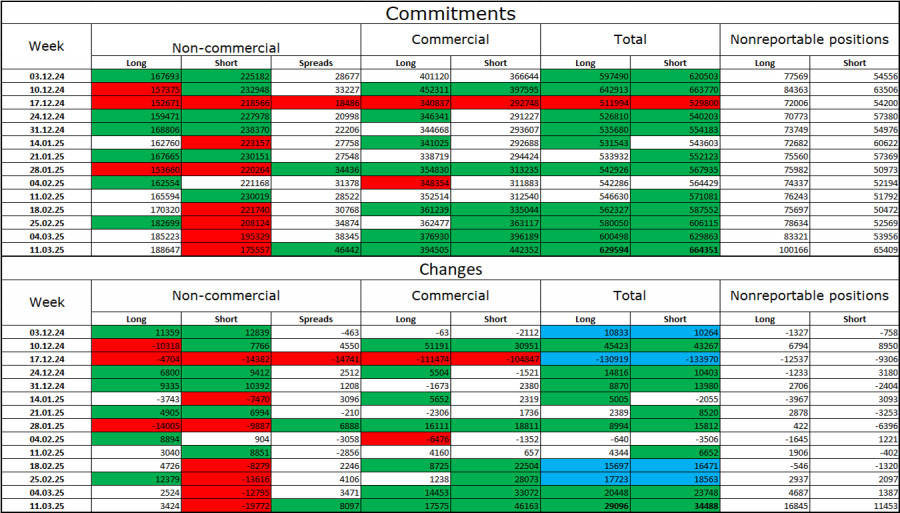
During the last reporting week, professional traders opened 3,424 long positions while closing 19,772 short positions. As a result, the "Non-commercial" category has turned increasingly bullish—largely thanks to Donald Trump.

The total long positions among speculators now stand at 188,000, while short positions have declined to 175,000.

For 20 consecutive weeks, large traders were reducing their euro holdings, but for the past five weeks, they have been unwinding short positions and adding longs. The divergence between ECB and Fed monetary policy still favors the U.S. dollar, given the interest rate differential.

However, Trump's policies remain the dominant market factor, as they could push the Federal Reserve toward a more dovish stance and even lead the U.S. economy into a recession.

Key Economic Events – March 18

  • Eurozone – ZEW Economic Sentiment Index (10:00 UTC)
  • Germany – ZEW Economic Sentiment Index (10:00 UTC)
  • U.S. – Building Permits (12:30 UTC)
  • U.S. – Housing Starts (12:30 UTC)
  • U.S. – Industrial Production Change (12:30 UTC)

Although the economic calendar includes five events, none of them are major market movers. However, the sheer volume of data releases could create moderate market impact on Tuesday.

EUR/USD Forecast and Trading Recommendations

Short positions are viable if EUR/USD breaks below 1.0818 on the 4-hour chart, with targets at 1.0734 and 1.0622.

Buying can be considered, but I remain cautious about the pair's relentless, nearly uninterrupted rally. I am wary of such one-sided price action, but that does not mean the uptrend cannot continue.

Fibonacci retracement levels are drawn from 1.0529 to 1.0213 on the hourly chart and from 1.1214 to 1.0179 on the 4-hour chart.

Pilih carta masa
5
min
15
min
30
min
1
jam
4
jam
1
hari
1
minggu
Jana pendapatan melalui perubahan kadar mata wang kripto dengan InstaForex.
Muat turun MetaTrader 4 dan buka dagangan pertama anda.
  • Grand Choice
    Contest by
    InstaForex
    InstaForex always strives to help you
    fulfill your biggest dreams.
    SERTAI PERADUAN

Artikel yang dicadangkan

AUD/USD. Permulaan Tarif pada 2 April Mungkin Memberi Tekanan kepada Pasangan Ini

Dolar Australia kekal dalam fasa pengukuhaan, berlegar dalam julat sempit 0.6265–0.6325. Pelaksanaan tarif oleh Trump yang akan datang terhadap China dan beberapa barangan dari Australia memaksa peserta pasaran untuk bertindak

Pati Gani 09:08 2025-03-27 UTC+2

#NDX – Tinjauan Analisis Teknikal

Pemberhentian pada paras aliran jangka pendek bulanan (19730) telah mendorong usaha oleh pergerakan menaik untuk mendapatkan semula kedudukan mereka. Hasilnya, jurang kenaikan terbentuk pada permulaan minggu dagangan baharu, disusuli dengan

Evangelos Poulakis 04:45 2025-03-27 UTC+2

Isyarat Dagangan EUR/USD untuk 26-28 Mac 2025: jual di bawah 1.0808 (SMA 21 - 8/8 Murray)

Menurut carta H4, euro kelihatan terlebih jual, dan kami percaya bahawa jika EUR/USD mendapat sokongan kukuh sekitar paras 8/8 Murray pada 1.0742 atau 1.0690, ia akan dianggap sebagai peluang untuk

Dimitrios Zappas 15:13 2025-03-26 UTC+2

Cadangan Dagangan untuk EMAS (XAU/USD) bagi 26-28 Mac 2025: jual di bawah $3,034 (21 SMA - 7/8 Murray)

Emas mungkin akan meneruskan kitaran menurun dalam beberapa hari akan datang. Untuk mengesahkan arah aliran penurunan ini, kita dijangka melihat penstabilan di bawah 3,020. Kemudian, harga berkemungkinan mencapai 6/8 Murray

Dimitrios Zappas 15:11 2025-03-26 UTC+2

EUR/USD. 26 Mac. Pasaran Penurunan Harga Sedang Bersedia untuk Serangan Baru

Pada hari Selasa, pasangan EUR/USD sekali lagi melonjak dari zon sokongan 1.0781–1.0797, tetapi pihak kenaikan menunjukkan kelemahan kerana kekurangan latar belakang berita yang menyokong. Hari ini, pasangan ini telah kembali

Samir Klishi 10:32 2025-03-26 UTC+2

GBP/USD. 26 Mac. Inflasi Mungkin Menggerakkan Pound

Pada carta setiap jam, pasangan GBP/USD terus bergerak mendatar pada hari Selasa, tanpa menunjukkan reaksi kepada tahap 1.2931. Oleh itu, penutupan baharu di atas atau di bawah tahap ini tidak

Samir Klishi 10:29 2025-03-26 UTC+2

Analisis Teknikal Pergerakan Harga Harian bagi Pasangan Mata Wang Silang AUD/JPY, Rabu, 26 Mac 2025.

Dapat dilihat pada carta 4 jam bahawa pasangan mata wang silang AUD/JPY bergerak dalam saluran Menaik dengan harmoni dan berada di atas EMA (21) yang juga mempunyai cerun yang cenderung

Arief Makmur 09:34 2025-03-26 UTC+2

Analisis Teknikal Pergerakan Harga Intraday bagi Indeks Nasdaq 100, Rabu 26 Mac 2025.

20405.7 Dengan kemunculan penumpuan (Convergence) antara pergerakan harga indeks Nasdaq 100 dan penunjuk Pengayun Stochastic, serta pergerakan harga yang kini berada di atas EMA(21) yang turut menunjukkan kecenderungan menaik, dalam

Arief Makmur 09:34 2025-03-26 UTC+2

EUR/USD dan GBP/USD 26 Mac – Analisis Teknikal

Seperti permulaan minggu ini, pasaran penurunan harga cuba untuk mengesahkan dan melanjutkan aliran menurun yang sedia ada, tetapi mereka masih belum mencapai hasil yang kukuh — Pasangan ini terus kekal

Evangelos Poulakis 04:26 2025-03-26 UTC+2

GBP/USD. 25 Mac. Pound Bergerak Dalam Julat Mendatar

Pada carta setiap jam, pasangan GBP/USD telah membuat pengukuhan di atas paras 1.2931 pada hari Isnin, namun pergerakan menaik gagal mengekalkan momentum kenaikan dan akhirnya berundur. Pasangan ini kemudiannya bergerak

Samir Klishi 17:58 2025-03-25 UTC+2
Tidak boleh bertanya sekarang?
Tanya soalan anda di Ruangan bersembang.
Panggilan semula Widget
 

Dear visitor,

Your IP address shows that you are currently located in the USA. If you are a resident of the United States, you are prohibited from using the services of InstaFintech Group including online trading, online transfers, deposit/withdrawal of funds, etc.

If you think you are seeing this message by mistake and your location is not the US, kindly proceed to the website. Otherwise, you must leave the website in order to comply with government restrictions.

Why does your IP address show your location as the USA?

  • - you are using a VPN provided by a hosting company based in the United States;
  • - your IP does not have proper WHOIS records;
  • - an error occurred in the WHOIS geolocation database.

Please confirm whether you are a US resident or not by clicking the relevant button below. If you choose the wrong option, being a US resident, you will not be able to open an account with InstaForex anyway.

We are sorry for any inconvenience caused by this message.