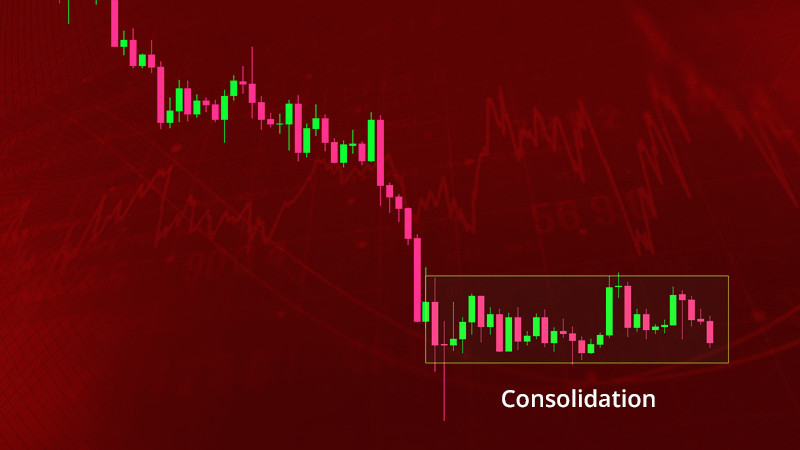
There are periods in the market when an asset is inactive, with no movement in one direction or another. In trading, they are called consolidation, or flat.
There are certain nuances that you need to know and take into account when trading during such periods. In this article, you will find out these nuances and other subtleties related to flat periods in detail.
To learn more about the trading process in financial markets as well as various trading tactics, read the article "What is trading".
Consolidation trading in simple terms
In reality, consolidation in the market is not rare. It is also called flat, or a sideways movement. In such periods, an asset typically trades within a rather tight price range.
This range is limited by the levels of support and resistance. The support level is the lower one and is charted by drawing a line along lows, while the resistance level is the upper one and is charted by drawing a line along local highs.
Analysts believe that in such periods, market participants are hesitant. In an uptrend, the lead in the market is taken by buyers, also known as bulls. In a downtrend, sellers, or bears, enjoy dominance.
During periods of sideways movements, neither bulls nor bears have a significant advantage. Trades usually take a wait-and-see approach. Consolidation in the market alternates with a directional movement of an asset.
At the same time, a flat market can be seen as a break, after which the price continues to move as before. However, it may be followed by a movement in the opposite direction.
In case a flat market is preceded by an uptrend and the price breaks through the upper boundary of the range, an asset continues to trade upwards.
If a flat market is preceded by an uptrend, but the price breaks through the lower boundary of the range, the market usually sees a trend change, from upward to downward.
In case a flat market is preceded by a downtrend and the price breaks through the upper boundary of the range, the trend changes to an upward one.
If a flat market is preceded by a downtrend and the price breaks through the lower boundary of the range, the market continues to move downwards.
What causes consolidation trading?
A sideways market can occur for several reasons. To determine what caused consolidation in trading, it is necessary to first define where it has formed.
It is important to understand that markets are mainly influenced by large institutional investors and professional traders representing major companies.
This is why their actions could lead to significant market shifts and move the price of an asset in the direction they desire.
1. Profit-taking is one of the factors for the formation of a flat market. Traders tend to lock in profits when the market has been showing a sustained upward or downward movement for quite a long time.
After such consolidation, the price often goes in the direction it previously moved. This is mainly due to professional traders who hold large positions and offset the positions of retail traders.
Consequently, the positions of smaller market participants who still count on a continued trend are canceled, and the directional movement of the price comes to a halt.
2. The accumulation or distribution of positions is a situation in which there is a shift from a dominant trend to the opposite one. Large market participants begin to open positions against the current trend, which is why the price changes its course.
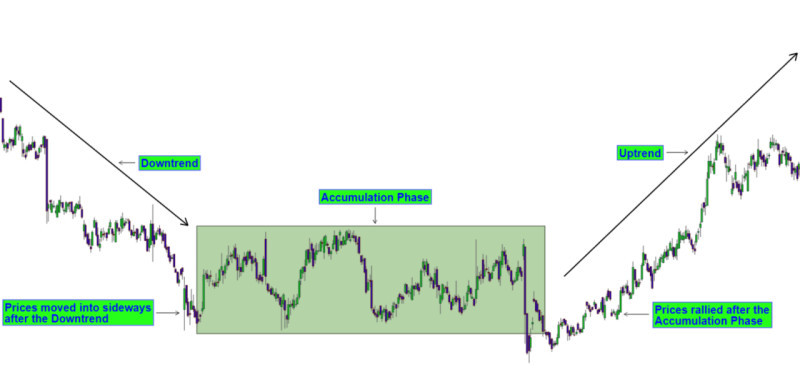
The accumulation phase occurs after a prolonged downtrend. In this case, large players gradually increase their long positions, thus triggering a trend reversal to the upside.
The distribution phase occurs after a prolonged uptrend. Large traders begin to close their long positions and open short ones, causing a bullish-to-bearish trend change.
Consolidation period: what it is, examples
A period of consolidation can be found on price charts for any time interval. Depending on the selected time frame, it can last from several hours to several months.
Furthermore, in shorter time frames, there is a high probability of receiving a large number of false signals due to many price fluctuations.
However, short time intervals also find their admirers such as scalpers and other traders who prefer short-term strategies. The peculiarity of their tactics lies in opening a large number of small trades, so every price fluctuation matters to them.
How to determine that the market has entered a sideways range? It is often easier to do with securities that have clear support and resistance levels. These lines can form various patterns: rectangles, triangles, and wedges.
Additionally, one can be guided by the width of the range. As we have already mentioned, the range in a sideways market tends to be quite narrow. Nevertheless, all trading assets have different volatility levels. Hence, their price fluctuations can vary.
The third aspect to consider is trading volumes. This indicator is crucial and should not change dramatically. Throughout the consolidation period, trading volumes should remain low.
When defining a sideways movement, a user needs to consider all three factors: the chart's movement between support and resistance levels, the narrow width of the range, and lower trading volumes.
Consolidation patterns
Consolidation does not necessarily take the form of a clear rectangle. The chart might form other patterns, some of which indicate a continued trend, while others signal a trend reversal.
• Wedges are chart patterns marked by two lines, which are not exactly parallel to each other, with the channel itself inclined upward or downward. A wedge can be ascending when both lines are directed upward or descending when the lines are heading downward.
One of the boundaries has a steeper slope than the other, which is why they intersect with each other. As a result, the channel boundaries become increasingly narrow until the chart eventually breaks through one of the boundaries.
• Triangles are also formed by two converging lines that eventually intersect with each other. Triangle patterns can be descending, ascending, or symmetrical.
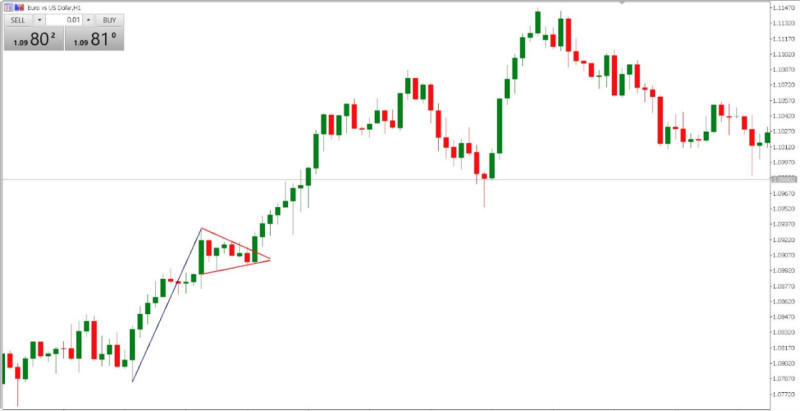
• Flags and pennants are relatively small consolidation patterns. These figures form after a sharp price movement and resemble a flagpole.
These patterns fall under the continuation category and signal a potential price movement in the previous direction.
• Double/triple tops and bottoms belong to the reversal pattern category. They form after a prolonged bullish or bearish trend.
A double/triple top indicates the market entering a distribution phase, while a double/triple bottom signals the start of an accumulation phase.
How to trade consolidation patterns
There are two main ways to trade during a consolidation period: to conduct range-bound trading or breakout trading. So, when to use each of these methods? Let's try to figure it out.
As mentioned earlier, the width of the range depends on the trading instrument’s volatility. If price fluctuations are not significant, the range will be relatively tight. Thus, trading within it may not be profitable.
However, if price fluctuations are significant enough, short-term trades within a range can be advantageous to scalpers. To do this, you need to use shorter time frames.
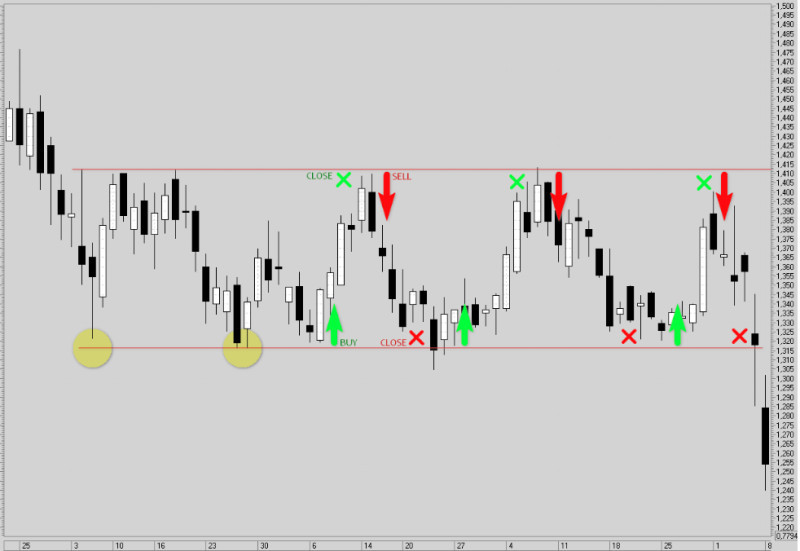
Positions can be opened when the price bounces off one of the channel boundaries. Going long is relevant in case of a rebound from the lower boundary, while short positions can be considered amid a pullback from the upper boundary of the channel.
If the range is too narrow and not suitable even for scalping, you can look for breakout trading opportunities. To do this, you need to monitor market developments and look for signals indicating an imminent breakout.
If consolidation has been preceded by a downtrend and the chart breaks below the lower boundary, you should go short. If the price goes up, it indicates a trend reversal and an opportunity to open long positions.
In the reverse situation, after a bullish trend, when the chart breaks above the upper boundary, you can go long. When the chart crosses the lower boundary, the trend changes and you can open short positions.
Here, you can choose between two trading approaches: aggressive and conservative. With an aggressive trading style, trades can be opened immediately upon the chart crossing one of the channel boundaries. With a conservative approach, you should wait for the price to retest the boundary and then open a trade.
Notably, for a valid breakout, not a false one, the entire candlestick must fully extend beyond the range boundaries, not just its wick.
Breakout signals
Not to miss the best entry points, it is essential not only to understand when a breakout will occur but also in which direction the price will continue its movement.
To determine the price direction after consolidation, you need to consider various factors. Let's mention the key ones:
• The direction of a price movement before a sideways market. In most cases, the dominant trend continues after a brief pause in the form of a flat market. The trend remains intact until a reversal occurs.
• The pattern formed during a flat market. As mentioned above, the price can form various patterns during consolidation. Price formations like rectangles, triangles, flags, and pennants are considered continuation patterns.
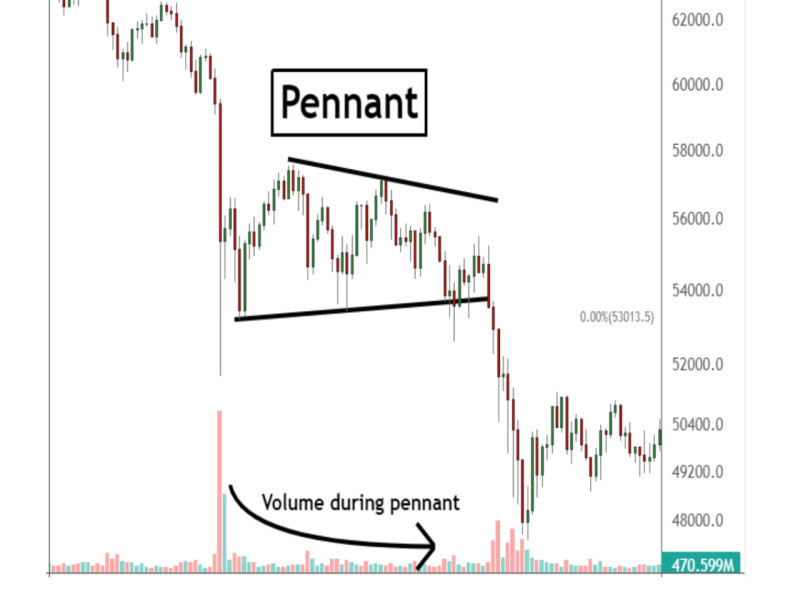
• Changes in trading volumes. In a sideways market, trading volumes are low and there are no sharp spikes. However, when the consolidation trading process comes to an end, trading volumes begin to increase.
If a breakout of one of the channel boundaries coincides with an increase in trading volumes, it indicates a continued move in the same direction.
• False breakouts. Such breakouts are a frequent phenomenon in the market. They can help determine the direction in which the chart will make a real breakout. Often, a breakout occurs in the opposite direction to that of the false one.
This is especially relevant if a false breakout happens against the trend preceding a flat market. Thus, if the direction of a false breakout is downward, the real one is likely to be upward. If a false breakout is upward, the real one will be the opposite, that is, downward.
How to distinguish trend from consolidation
As mentioned, horizontal price movements do not always occur in a tight range. This stems from several factors, the main one being the volatility of the asset chosen for trading.
If price fluctuations within a range are quite active, it can be difficult to distinguish them from a directional movement. Therefore, traders need to understand how to determine whether the prevailing market condition is a trend or a sideways movement.
1. One way to verify the presence of a trend in the market is to look for the patterns of HH (higher highs), HL (higher lows), LH (lower highs), and LL (lower lows).
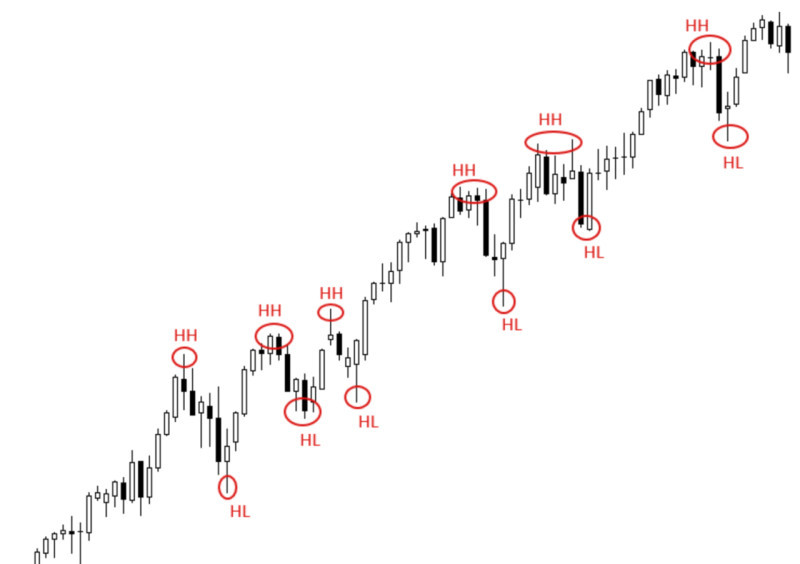
A bullish structure is defined by a series of higher highs (HH) and higher lows (HL). That is, peaks and troughs are shifting up. LH and LL patterns point to a bearish structure. In this case, peaks and troughs are shifting down.
To identify a potential change in the current trend, it is important to pay attention to the appearance of "incorrect" structures. For example, if an LH pattern appears in a series of HH and HL, this could signal a trend shift, especially if confirmed by the formation of LH and LL patterns.
2. To locate a sideways movement, you need to navigate support and resistance levels. Price moves within a range limited by these levels indicate a flat market.
The trend is said to be sideways even when the price mainly moves within a range but occasionally gets out of it. If the price is not stuck in a corridor, the current trend is directional.
3. Another method involves adding technical indicators to the chart. For example, the Moving Average (MA) is an indicator commonly used in technical analysis to identify a dominant trend.
Two MAs of varying time frames can be used simultaneously and generate stronger signals. Their convergence indicates market consolidation, while divergence points to a strong trend.
Indicators for sideways markets
When a directional trend ends, the market starts moving flat. To define the onset of a lateral move, you can use special indicators.
1. As mentioned above, trend indicators are often used to determine the current market state, the most famous of which are moving averages.
Two or three moving averages are often used together. Also, this indicator can be used to build new ones such as Williams' Alligator, Bollinger Bands, and others.
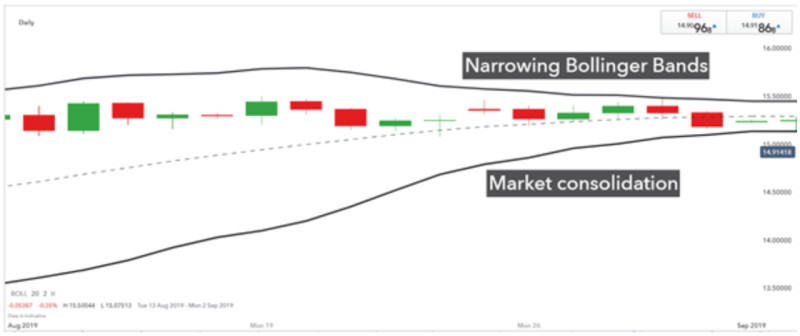
For example, Bollinger Bands are indicators comprised of three MAs of different time frames. When they are close to each other, the market is in a consolidation phase. When bands diverge and form a wide range, a trend movement dominates the market
2. Oscillators are also used to identify periods when there is no clear trend in the market. They do not indicate the direction of a breakout but help locate a flat market.
For instance, the Accelerator Oscillator (AC) is quite effective in identifying a horizontal movement as with low-frequency oscillations, its histogram fluctuates close to the baseline.
Another popular indicator is the Relative Strength Index (RSI), which shows the ratio of higher closes to lower closes. Periods of consolidation can be confirmed by the absence of a divergence pattern.
3. Besides, you can benefit from volume indicators such as On-Balance Volume, Volumes, and others. A sideways market is characterized by lower trading volumes.
At the same time, it is necessary to distinguish the periods of active struggles between bulls and bears when this group of indicators shows increased opposite volumes.
Conclusion
In this article, we have examined the most important aspects of a sideways asset price movement, also known as consolidation or flat.
Such periods occur quite often in the market as the price cannot constantly move in one way or another. The market periodically changes from bearish to bullish, and vice versa, but it also needs moments of lull.
These moments are called consolidation, which can be caused by traders taking some of their profits off the table or accumulating and distributing their positions.
Is it possible to trade in a sideways market? The answer is ambiguous as it depends on several factors. The main one is asset price volatility. The higher the volatility, the greater the range of price fluctuations.
If the range is not too tight, one can trade even during consolidation periods. Long positions are opened when the price bounces off the lower boundary of the range, and short positions — off the upper boundary.
However, the most common strategy is breakout trading, which involves opening trades when the price of an asset moves outside of the trading range.
When trading breakouts, traders need to pinpoint the moment of a breakout and determine its direction. To do this, one can use various indicators, including moving averages, oscillators, and volume indicators.
In addition, the very structure in which the consolidation trading occurs may indicate the further direction of a price movement. A sideways channel can form in the shape of trend continuation patterns or reversal patterns.
You may also like:


 Back to articles


