The pairs trading strategy was developed in the middle of the last century. Experienced traders kept it in secret for many years, so this strategy was revealed to the public only when the Internet technologies became widespread.
Almost 40 years passed since the creation of the pairs strategy, but it still remains relevant. Moreover, it has become quite popular. At the same time, those who are very well aware of what is trading are unlikely to call the pairs trading easy. Its intricacies may be too hard to comprehend. However, one should not abandon the idea of applying this strategy, as it can turn out to be quite efficient.
It remains unknown who has developed this strategy, though many traders claimed the authorship. Specifically, programmers Jerry Bemberger and David Shaw, as well as trader Nunzio Tartali are thought to be pioneers of the pairs trading. They carried experiments with automated trading, which was based on pairs trading. Their attempts brought brilliant results, as a highly-profitable system has been created. However, it was a success only at the beginning. In a year merely, hefty profits turned into hefty losses.
Indeed, understanding the intricacies and nuances of this strategy can sometimes take time and effort. However, it doesn't mean that one should give up on it, as trading can potentially bring high profits.
What is pair trading?
Pair trading is a neutral market trading strategy based on placing simultaneous opposing positions in two correlating instruments.
The correlation represents the interrelationship between several trading instruments, in most cases two, namely assets.
Two types of correlation
Type 1: direct correlation. Price movements of the first asset are almost identical to the second asset movements.
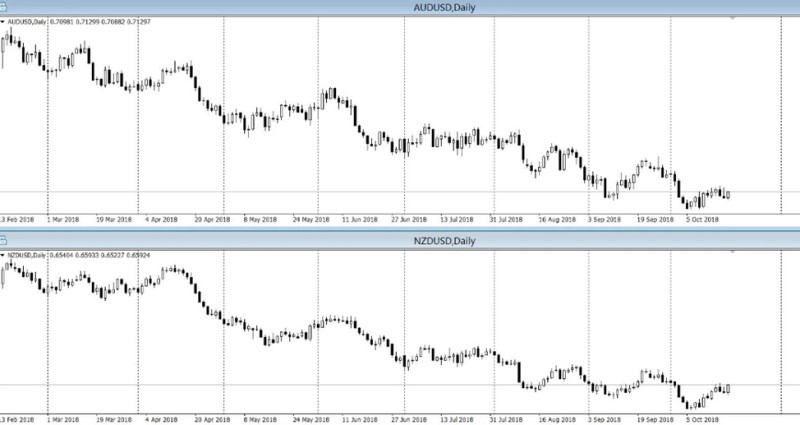
Type 2: inverse correlation. A price chart of one asset mirrors a chart of the other one.
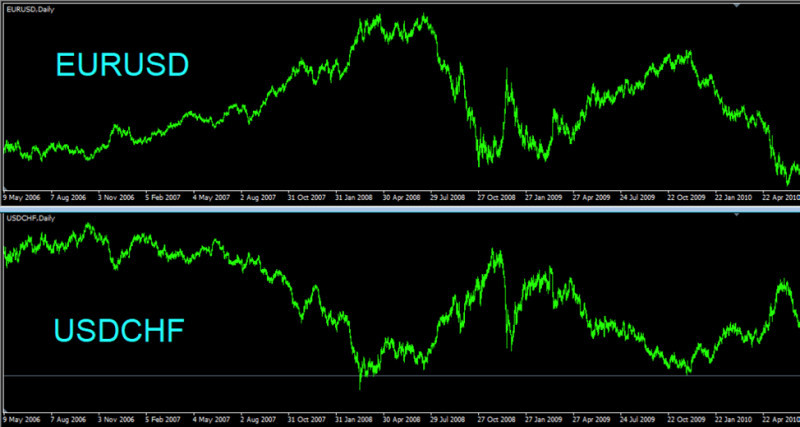
The key condition in this case is the synchrony.
| An example of direct correlation | Oil prices are directly correlated to oil companies stocks. A rise in oil prices entails an increase in stocks. The same refers to the opposite situation: when oil depreciates, stock quotes also decline. At the same time, either a rise or a fall in prices of these two assets are directly proportional to each other. |
| An example of inverse correlation | Gold price is inversely correlated to USD quotes. A rise in the American currencies leads to a fall in the precious metal price. Conversely, a fall in USD fuels demand for gold, pushing its price up. |
Take note! Examples of direct and inverse correlation only demonstrate a general trend. The movement of prices in each specific case are influenced by a range of other factors. For instance, the stock prices of oil companies may decrease or rise based on their respective prospects, meaning some may gain momentum quickly while others exhibit a more modest increase.
In pairs trading, temporary price divergences should be factored in.
The concept of price equilibrium is what really important in this context. Specifically, periodic divergences between closely interacting assets will always strive to equalize, returning to their usual average statistical indicators. Typically, assets are set in motion by fundamental events that are well-known to experienced traders, and they always pay attention to them when trading.
The list of major fundamental events closely monitored by markets:
- Meetings of central banks in different countries
- Federal Reserve meetings
- Reports about unemployment rate
- Consumer Price Index
- Gross Domestic Product reports
- Breaking news from international markets (sharp declines, growth, unexpected events, etc.)
The strategy of trading on paired instruments involves identifying assets with a high correlation. Buying undervalued assets is thus associated with simultaneously selling overvalued ones. It can be done only after one of the assets has gained or lost part of its value.
Where to apply Pairs Trading:
1) Stock markets
2) Commodities markets
3) Currency market
Pair trading is considered a neutral strategy in the market as it does not rely on the price direction. It is more important to accurately identify patterns of movement that may generate profits. This tactic is often adopted by large players, including hedge funds. They are attracted by the opportunity to profit regardless of whether the instrument is rising or falling.
How to use correlation in trading
It's fairly simple to use correlation in trading. It's only important to make the right choice of currency pair or other instruments to work with. All that is required from a trader is to closely monitor the price charts of correlated pairs. The moment when the price undergoes a negative correction in one asset can be a favorable opportunity to buy the instrument that is correlated with it.
Specifics of correlation trading:
- Pay close attention to factors that directly influence the instruments being used, both positively and negatively.
- Correlated assets are more suitable for long-term trading, as their prices little change in the short-term perspective.
- In highly dynamic and unstable markets such as Forex, one should closely monitor correlation as it can appear and disappear quickly. So it is necessary to diversify risks.
- Risk diversification can be achieved by selecting paired instruments with a high degree of correlation.
- Avoid superficial use of this strategy. For example, opening two opposite orders with the hope of profiting from one does not guarantee success, as losses in the opposite direction may outweigh the earnings from the first.
- It is important to factor in volatility, especially in the case of direct correlation. Twin charts, where assets movements are identical, are rare in the market. If one instrument moves, for instance, by 30 pips, it doesn't guarantee the same movement in another, which may move faster or slower.
One of the most reliable ways to apply the correlation method in the market is to search for signals to open or close trades. Entry/exit points can be determined with a high level of confidence for success.
How to apply pair trading
Nowadays, forex trading involves a wide range of strategies. They can be broadly categorized into three types: high-risk, low-risk, and neutral. Pair trading is typically classified as a neutral strategy. Profitability in this strategy is not determined by the market situation but rather by the accurate selection of suitable instruments.
When trading in the currency market, traders should carefully consider the selection of interdependent assets, specifically currency pairs.
Instruments are chosen in such a way that currency pairs move in the same direction within a specified time frame. Only after this can trades be opened in an opposite direction.
Importantly, currency pairs are not necessarily to move at the same speed or with complete correlation. There is often a gap between them, which will be eventually eliminated due to the similarity in currency behavior. The point of equilibrium or convergence of the instruments is of interest to traders. The entire process of pair trading on Forex revolves around attempting to reach this point.
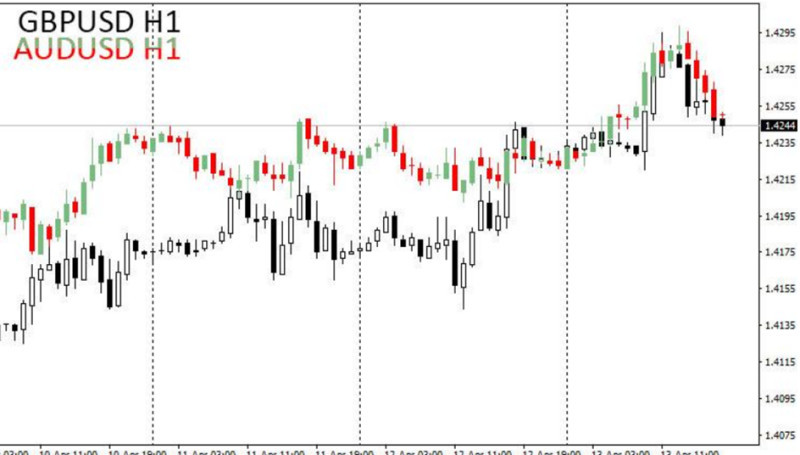
So, the use of pair trading on Forex implies trading the spread, i.e. the difference between prices of two currency pairs that is diminished upon their convergence.
Types of currency pairs correlation
One currency pair may correlate with another. The examples of such pairs are EUR/USD and GBP/USD.
A currency may correlate with commodity. Specifically, the Canadian dollar depends on oil prices, while the Australian dollar correlates with gold.
Currency pairs may also correlate with indices. Thus, the EUR/USD moves in conjunction with the USDX and the S&P 500.
Types of currency correlations in pairs trading
1) Mirror currency pairs have a visual similarity in motion.
• Currency pairs with the Swiss Franc (common in almost all currency pairs except the Japanese Yen).
• Currency pairs with the British pound (common in all pairs, but most frequently used with the US Dollar and the Japanese Yen due to their high volatility).
• Currency pairs with the Australian Dollar, specifically the euro and the British pound.
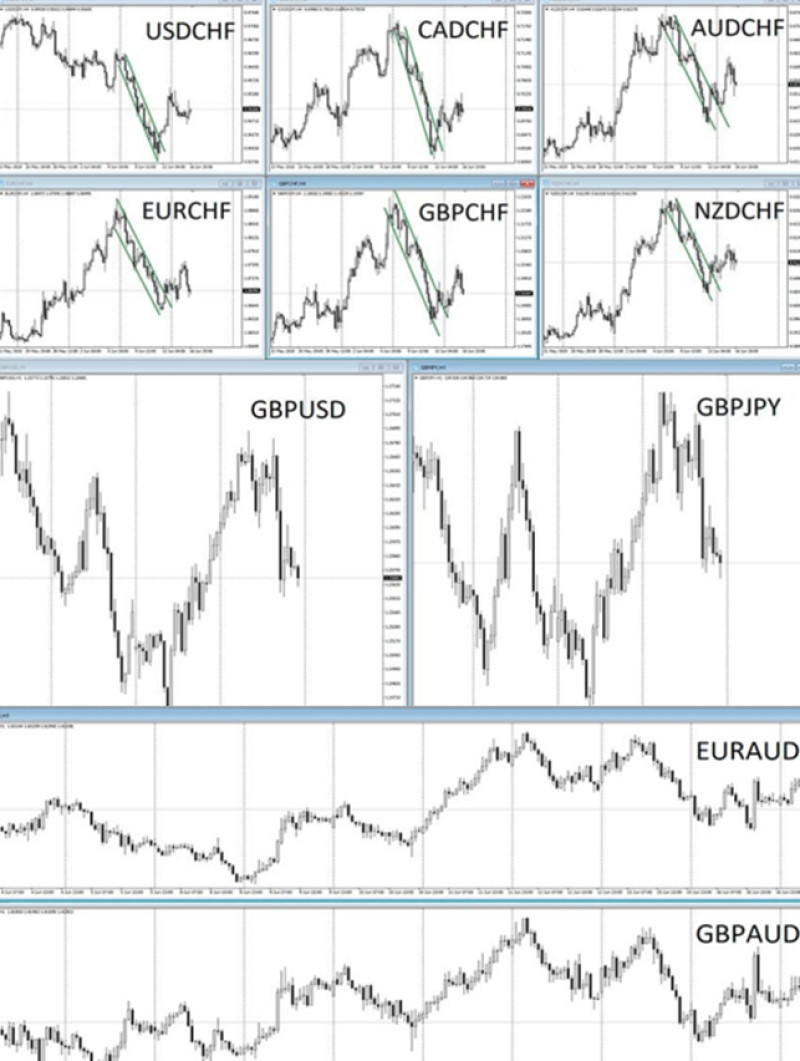
2) Currency pairs with negative correlation that move opposite to each other.
• EURUSD and USDCHF pairs (traders often choose it thanks to high volatility of the euro and US dollar).
• EURGBP and GBPJPY (the second one is more popular).
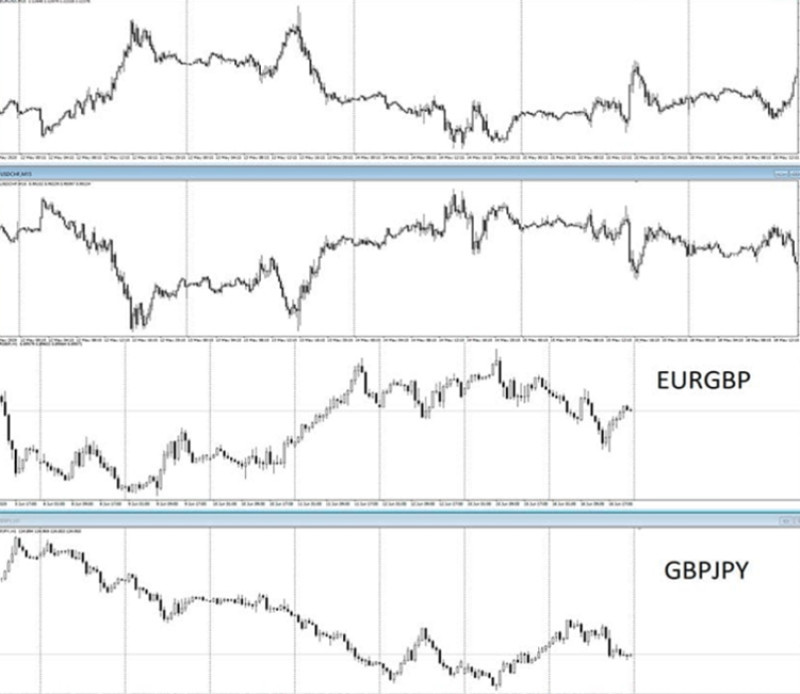
3) Currencies and currency pairs correlating with gold.
• USD and gold (inverse correlation).
• Euro and gold (mirror/direct correlation).
• EUR/USD and gold (mirror/direct correlation, movements of these assets are almost identical).
• Swiss franc and gold (direct correlation).
• New Zealand dollar and gold (direct correlation).
4) Currencies and currency pairs correlating with oil.
• Russian ruble and oil (direct correlation).
• USDRUB and Brent crude oil (inverse correlation).
• Canadian dollar and oil (direct correlation).
• USDCAD and Brent crude oil (strong inverse correlation).
• Japanese yen and Brent crude oil (inverse correlation).
• USDJPY and Brent crude oil (stable mirror correlation).
Two approaches to pairs trading:
First approach. The same factors influence changes in asset movements. As a result, impulses may occur at the same time. An example of this can be seen in the interaction of currencies of countries that export oil.
Second approach. The basis for this approach is closely interrelated economies of countries. Their interdependence causes national currencies to move in tandem. For example, changes in the Russian ruble are reflected in the Kazakhstani tenge.
The relation between currencies in a pair is crucial when using the Pairs Trading strategy. The level of their correlation depends on various factors. The overall condition of the financial market, which undergoes frequent transformations, is of significant importance. Interdependent currencies should be subjected to thorough scrutiny and analysis to ensure truly fruitful work.
Two methods of checking currency correlation:
1. Manual. A trader can check the correlation by plotting price charts for the same period in a special program. This way, they can identify similarities or differences.
2. Using correlation coefficient tables. This is a ready-made tool that needs to be properly interpreted.
It's rather difficult and time-consuming to check all correlations in practice and identify the most successful ones. Modern traders lack the strength and time for this. Therefore, it is recommended to use ready-made correlation coefficients gathered in a separate table.
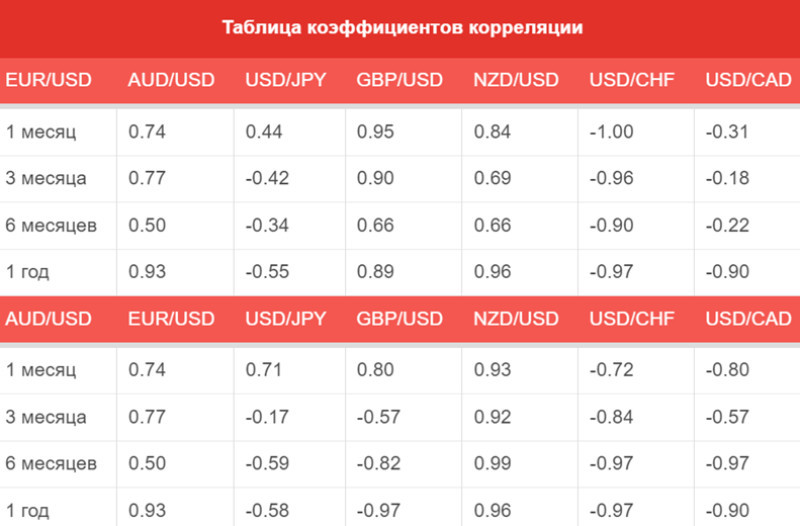
Correlation Coefficients Table
The correlation coefficient is a measure of the close relationship between quotes of different currency pairs. In other words, on Forex, it refers to a selected and analyzed set of statistical data on the directions of currency movements.
The indicator ranges from +1 to -1. A value of +1 indicates a complete match, while -1 indicates absolute difference. The closer the currencies are linked, the closer the indicator value is to 1. This is what traders look for in the table. Of course, +1 is an ideal value that is not frequent in the market. However, it doesn't mean that other assets with lower values cannot be used. In such conditions, traders need to analyze the market situation more carefully. Additionally, it is important to consider inverse correlation, which can also be traded profitably.
How correlation coefficient values influence currency pairs
| Coefficient | Meaning |
| 1 | Pairs movements are identical |
| 0.5 – 0.9 | A high degree of correlation results in a higher value, indicating a greater degree of one-directional movement. |
| 0.1 – 0.5 | lower correlation, higher dependance |
| 0 | no correlation |
| -0,5 – 0,1 | lower correlation, higher dependance |
| -0,9 – -0,5 | higher correlation combined with differently-directed price trajectories |
| -1 | prices move in different directions, while one asset rises, another one declines |
Pairs trading can be an efficient way of getting profits. At the same time, the balanced approach can ensure stable profits with minimal risks. To reduce risks, traders need select currency pairs correctly, i.e. there correlation should be sustainable.
Basic principles of pairs trading applied to crypto
Cryptocurrencies are a unique instrument in the international market, and traders tend to choose strategies that have proven successful in trading other assets. The main difference of crypto assets lies in their trend formation. Additionally, price movements of this instrument are easily predictable, so trading crypto is more efficient and easier.
Nowadays, market participants are increasingly using the pairs trading strategy when working with cryptocurrencies. However, it has not yet become one of the most common strategies in this sector. It involves simultaneously opening two trades, which significantly contributes to the overall potential profit. It's worth noting that pair trading is a low-risk strategy, meaning the risk of losing capital is not as high as when using other trading tactics.
However, trading crypto requires certain skills and knowledge that are easy to obtain.
Rules for trading cryptocurrencies using the pairs trading strategy:
1. Implementing unidirectional dynamics when trading paired assets, with a focus on the degree of correlation. Thus, the strength of movement becomes a crucial component.
It is important to remember that Bitcoin is the central player in the sector. Virtually all other instruments depend on the direction of its movement. The difference lies in the level of pressure exerted by the key asset and their potential for correlation. Example 1: The changes in altcoins are directly related to what happens with Bitcoin, but despite the fairly strong correlation, they lack the resources for significant dynamics. Therefore, such a combination cannot be considered favorable for trading.
Example 2: Ethereum or Litecoin are much better suited as correlated coins for each other. Both Ethereum and Litecoin have the ability to influence the entire market, so their interaction will be more accurate and convenient for trading. Additionally, the direction of dynamics aligns between them as well.
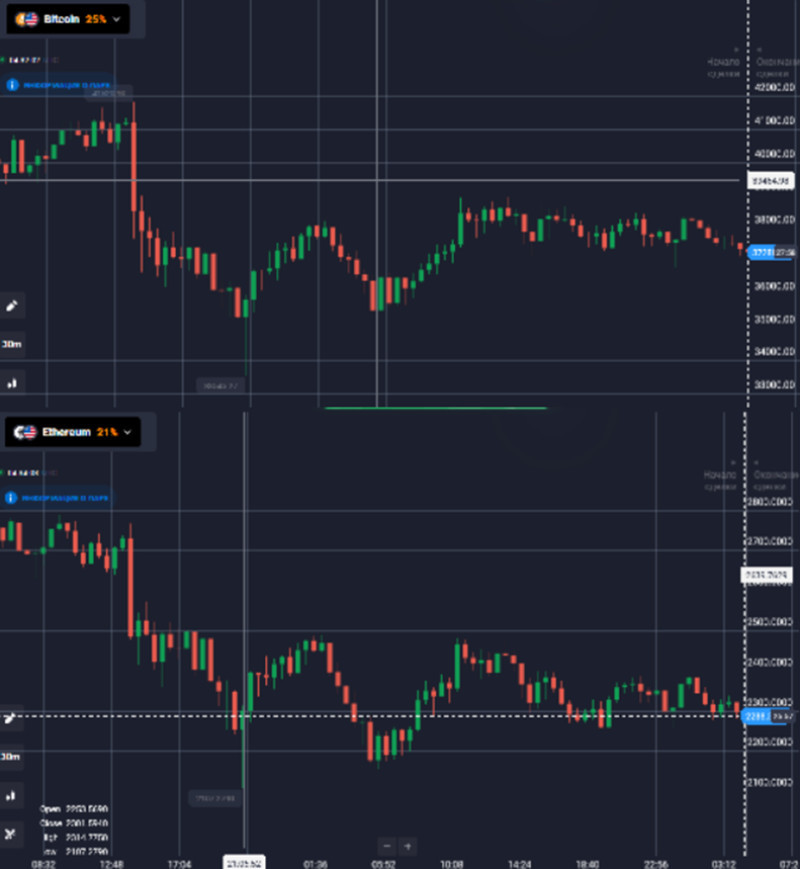
2. The key concept is the difference between two assets in question. It should be the basis for building your strategy. How can it be calculated? Simply divide the exchange rate of one instrument by the cost of another. Graphical analysis is necessary here to demonstrate the relationship between the exchange rates. To track the direction and dynamics of assets, constant recalculation of the difference is required. The greater the difference, the stronger the disparity in quotes. It means that the instrument with lower cost should be sold and the one with higher cost should be bought.
Important! The use of this method is justified only if trades on both assets are profitable.
3. In some cases, the difference between assets may reduce. In such cases, it is advisable to open positions in one direction, which may ensure a profit in one of the trades. However, it's important to remember that sometimes the profit may not be sufficient to cover the losses.
Example: Let's consider trading the Bitcoin/altcoin pair. In most cases, Bitcoin starts rising first, and the altcoin follows along later. This means that their movements may not align perfectly in terms of timing. In such a case, it would be reasonable to open a trade on Bitcoin using a short time frame (around ten minutes), and then trade the altcoin with a longer time frame (a few hours). After just a couple of minutes, you'll be able to see when the assets have started moving in different directions, making it easier to determine the difference between them.
Pros and cons of pairs trading in the crypto market
| # | Advantages | Disadvantages |
| 1. | It's quite easy and fast to start implementing this method. To calculate the price difference, one should not have to apply complex parameters. It's enough to use current quotes. | It is necessary to analyse and check assets correlation. If there is no correlation, it is advisable to refrain from working with those particular instruments and look for alternatives. This may require additional time and effort. |
| 2. | Automation of the order opening/closing program. Analysis of only one indicator allows you to train the trading platform to the specified algorithm in a short time. So, this method enables you to use additional advisors and robots. | Mixed price movements do not guarantee a high profit. There are cases when the losses in one trade do not cover the profits in the other. |
| 3. | Reduced risks of losses. It is possible to diversify risks by trading two assets at the same time. |
A cryptocurrency exchange, like any other trading venue, does not have universal ways of trading and earning. It is necessary to revise and adjust trading strategies from time to time, because they often lose their relevance and, consequently, stop bringing profit.
Pairs trading on cryptocurrencies is easy to learn even for novice traders, and the consequences of mistakes here are softer than in the case of any other tool.
Conclusion
The latest trends in the international market indicate that neutral strategies are gaining popularity among traders, and one such strategy is Pairs Trading. However, it shouldn't be considered overly simple. Pairs Trading has its own peculiarities that are important to understand before implementing it in practice. Firstly, market participants should be able to find suitable correlated instruments. Secondly, traders need to practice analyzing statistical data. Thirdly, it's important to choose the most optimal moment to enter the market, as it largely determines its effectiveness.
Besides, it's crucial to remember that despite its apparent simplicity, pairs trading is not a guaranteed way to earn high profits. Sometimes it may not work as expected. This is because the correlation between instruments can quickly emerge or disappear without apparent reasons.
Therefore, it's necessary to follow a set of rules to protect your capital. Specifically, before engaging in real trading, it is advisable to test your strategy on a demo account.
You may also like:
Standard deviation trading strategy


 Back to articles

