Those who have just started their journey in stock trading wonder how to read candlestick charts correctly. Indeed, these charts are believed to be highly informative, and every trader wants to make good use of them.
In this article, we will discuss what the process is based on and what details need to be considered when reading charts. You will also learn whether it is necessary to read charts yourself.
If you are looking for more information about charts, read our Trading Charts. There we have outlined the key information about different types of charts.
How to interpret Japanese candlesticks
Japanese candlesticks are believed to be the most useful and effective trading tools as they offer more visual information than any other charts. This is what makes them so popular among traders.
Candlesticks were introduced on stock exchanges in the US and Europe in the 1980s after Steve Nison presented this type of chart to the public. But in fact, candlesticks have been used in trading for several centuries.
Thus, Japanese rice traders used candlestick charts to increase sales of their harvest.
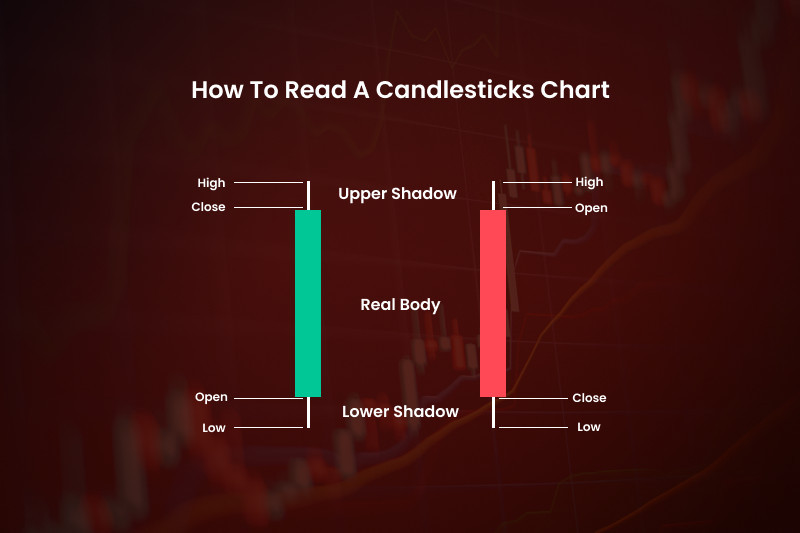
See the structure of a candlestick in the screenshot below. Each element reflects four main price characteristics: open and closing prices and two extremum points.
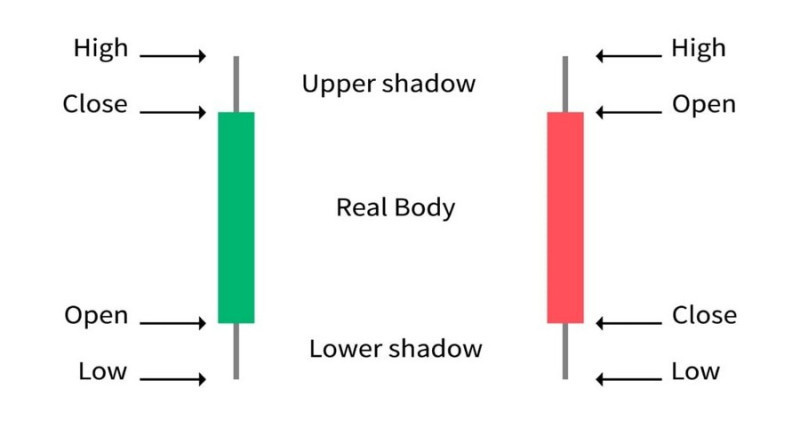
The distance between the opening and closing prices within a certain time frame is presented with a central part called a candlestick body. The shadows of the candlestick show the highest and the lowest price.
Visually each element resembles a candle which explains its name.
So, how does a candlestick form?
The stock market is a constant tug-of-war between bulls and bears. When bears are prevailing, an asset is losing its value as supply exceeds demand.
If bulls are in control of the market, the price of an asset is rising.
Therefore, in the first case, we will see bearish candlesticks colored red or black.
In the second case, the body of the candlestick will be white or green.
Each new candlestick appears on the chart with a certain frequency. For example, on the M5 time frame, candlesticks will appear every five minutes.
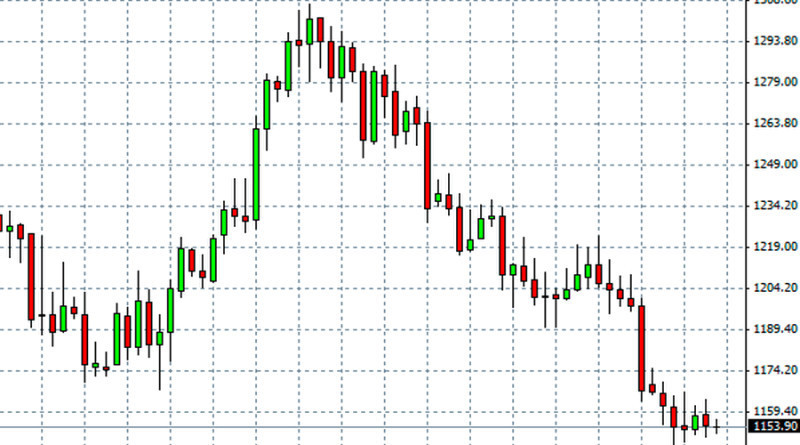
If there are several elements of the same color on the chart, we are talking about a clear uptrend or downtrend. If the shadows of the candlesticks are short, this means that a trend is stable and has strong potential.
Whether this is a short-term or a long-term trend, we can say based on the selected time interval. For example, if you see a set of green candlesticks on a daily time frame, you are most likely dealing with a large-scale trend.
On a shorter time frame, this can be a short-term trend or even a correction.
With the help of Japanese candlesticks you can:
- See how the price is changing;
- Identify the market sentiment, the balance between buyers and sellers, and the possible development of the trajectory;
- Forecast the direction of the asset’s price;
- Find entry and exit points to open or close a position.
Candlesticks vs other charts
To demonstrate the effectiveness of Japanese candlesticks in more detail, let's compare them with other types of charts.
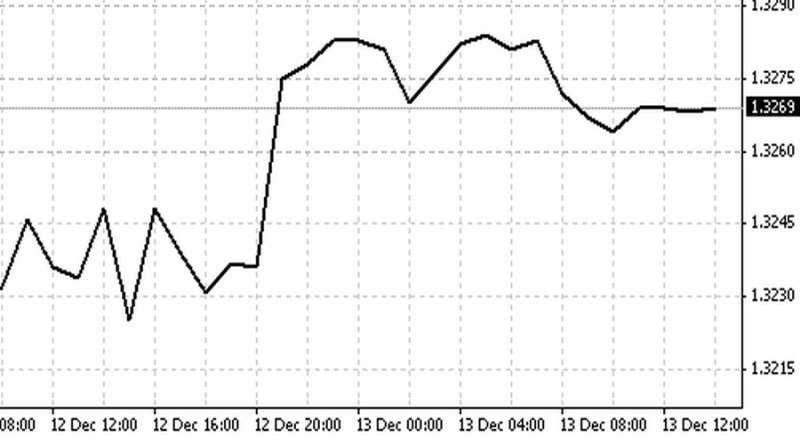
1. Line chart: the dynamic of an asset is displayed as a line that connects the values of the price, most often the closing price.
This chart allows you to quickly assess the overall picture in the market and determine the prevailing trend. A line chart is quite often used by beginners as it is the simplest type of chart.
But at the same time, a line chart is far less informative compared to a candlestick chart. It contains only one type of price data, while the candlestick chart contains four;
2. A bar chart, like a candlestick chart, is based on the opening and closing prices and extremum points. In terms of presenting information, these two types of graphs are the same.
The two types of charts are different in terms of reading. The fact is that each bar visually represents a vertical line with horizontal lines.
The bar on the left indicates the opening price, while the closing price can be recognized by the dash on the right. That is, to assess the overall market dynamics, a trader will have to compare the location of all the lines, which will take time and develop observation skills.
And if all the bars on the chart are of the same color (for example, the color settings are not enabled or absent at all), the visual reading of the chart becomes even more complicated. An amateur trader will see a set of lines with strokes, which only remotely reflects the market situation.
Meanwhile, Japanese candlesticks have all the advantages of other types of charts. Providing the maximum information, they are easy to understand at the same time.
That is why they are valued and used by traders with different trading experience.
How to read candlesticks chart in stock trading
The first thing you need to analyze candlestick charts is to know what each candlestick consists of. We have mentioned them at the very beginning of our article.
When reading a candle, it is important to pay attention to the color, body, and shadows of a candlestick.
The direction of the price movement and the balance between bulls and bears can be determined by visually reading the candles on the stock exchange. The main thing in this regard is to catch the psychology of the market, that is, to understand the intentions of sellers and buyers.
With the color of the candlesticks, everything is extremely very simple. When the closing price is lower than the opening price, the body turns red or black. In the opposite situation, the body turns green or white.
It is worth noting that in some cases, using the settings, you can change these standard colors to others.
Now let's take a closer look at the body and shadows.
The body of a candlestick is the most important parameter. If after several short bodies, a full-bodied candle appears on the chart, then sellers or buyers have taken a confident leading position.
You can see who has won by checking the color. Now let's move on to the size of the central part. Large bodies serve as a confirmation of the current dynamics or the beginning of a new trend.
If the central part is small, this indicates that both bulls and bears have similar chances to take over. This is most often observed when the trend is exhausted or enters a correction.
In such cases, a reversal or a flat movement can soon take place.
Shadows of Japanese candlesticks reflect the sentiment of market participants.
If there is a long upper wick and a short lower wick on the chart, it means that there were active buyers in this time frame and they have significantly raised the price. But later, sellers came into play, lowering the price to the closing level due to increased supply.
When a lower wick is longer and an upper wick is shorter, the situation is just the opposite.
When analyzing the wicks, you don’t have to pay attention to the color of the central part, since its color in this case has almost no meaning.
Key takeaways:
- When reading Japanese candlesticks, it is important to first check its main element - the body. Then you should analyze the shadows, or wicks, which in fact display price noise;
- A large body with short shadows means the start of a new trend. Such configuration shows that either bulls or bears are winning;
- A short body with long shadows may indicate a reversal in the trend. This signal is considered reliable when one wick is much longer than the other;
- Japanese candlesticks with short bodies and shadows are usually observed during a flat movement.
Variations of candlestick patterns
When dealing with Japanese candlesticks, a trader needs to spot certain formations on the charts to define a future price movement.
These patterns are based on certain principles:
- For a long time, analysts were observing certain formations on the charts that tend to repeat with time. We mean only graphic patterns as we do not consider mathematical models.
- As practice shows, the price moved in a similar direction each time after the formation of the pattern was completed. This means that a pattern predicts a certain market situation;
- Therefore, the price will most likely behave the same with each of the formations.
The patterns on the chart may either indicate a reversal of the trend or its continuation. These patterns can consist of one element or they can have two or more candlesticks.
How to read simple patterns
Simple formations are the easiest to read as in this case, it is enough to find one element on the chart that matches the description.
This group of patterns includes:
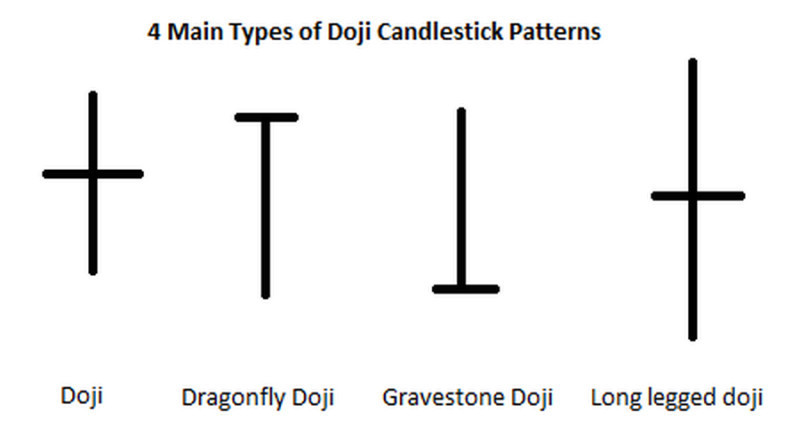
1. The Doji candlestick is one of the most important reversal patterns that can be used when trading on the stock exchange. Its appearance can be interpreted as a state of uncertainty and indecision in the market.
The body of an ideal Doji has the shape of a horizontal line which means that the opening and the closing prices are identical. This formation signals a reversal, but only if it appears near the support and resistance levels, that is, at the peak of a bullish trend or at the bottom of a bearish trend.
Doji trading involves opening positions after receiving confirmation of a reversal. You can enter the market when one or two candlesticks have confirmed the reversal of the trend.
If the Doji is observed in the middle of a trend, this can be regarded as a temporary consolidation.
This pattern has several variations such as Rickshaw, Gravestone, and Dragonfly. Quite often, it is part of other more complex patterns.
2. The Marubozu candlestick is characterized by a long body and no shadows. Sometimes, the shadows can be very short. An ideal Marubozu has no wicks at all. In some variations, there is no shadow only on one side (Open or Close).
If you see this pattern on the chart, the trend is likely to continue.
3. A Spinning top is recognized by a small central part and long shadows of equal length. This pattern serves as the first signal of an upcoming reversal if found at the peak of the bullish trend and at the bottom of the bearish trend.
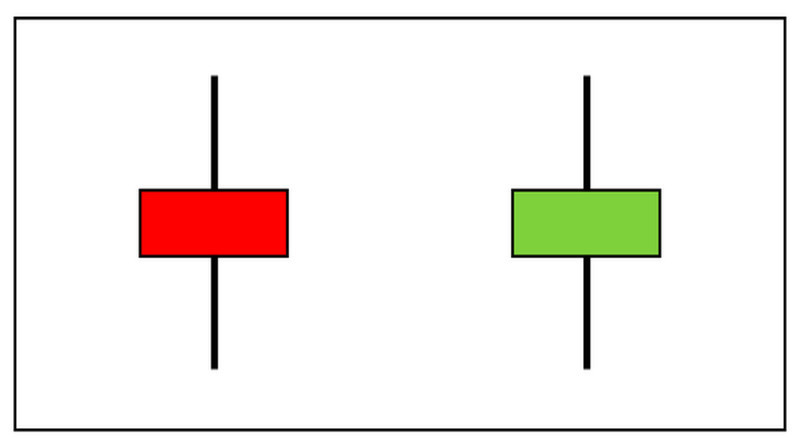
4. The name Hammer speaks for itself. This is a reversal pattern which is very common in stock trading.
A Hammer has a short body and a long lower shadow. The upper shadow is absent. A bullish pattern appears at the bottom of the downtrend.
A bearish pattern is seen at the peak of an uptrend. It is called a hanging hammer.
There is also an Inverted Hammer, and its bearish type is called a Shooting Star. All of them signal a change in the current trend.
How to read complex patterns
Now let’s discuss patterns consisting of two candlesticks.
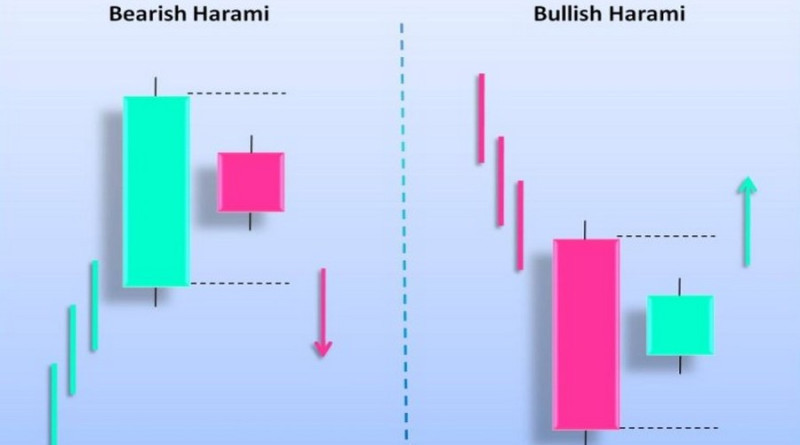
1. The Harami candlestick usually appears at the end of the trend and predicts a change in the price direction. It consists of a bullish and a bearish candlestick, and the first one is usually significantly longer than the second.
In the bullish version, the second candlestick is rising, while in the bearish version, it is falling.
2. Engulfing is a pattern similar to Harami with the only difference that the fist candlestick is being overtaken, or engulfed. Sometimes it is called inverted engulfing. Its appearance on the chart clearly signals a reversal of the price movement.
3. Dark Cloud Cover is another bearish reversal formation signalling that an uptrend has come to an end. It is represented by two Japanese candlesticks with large bodies and short shadows. The first candlestick is white or green, while the second one is black or red.
Importantly, the open and close of the first candlestick must be higher than that of the second candlestick.
The Piercing Line pattern is the opposite of the Dark Cloud Cover. It brings a rise in the price after a downward movement.
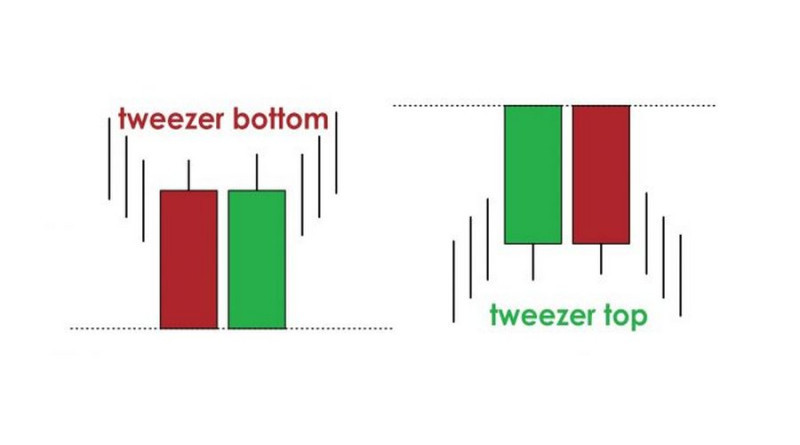
4. A Tweezer is a reversal pattern which is rather common on stock charts. It consists of two elements with different meanings that are almost equal in length.
It can be found at the peak of the uptrend or at the bottom of the downtrend.
How to read triple candlestick patterns
These formations are the hardest to spot on the chart as they require a trader to consider the characteristics of three candlesticks at once.
Triple candlestick patterns include:
1. The Morning Star which is characterized by:
- a large red or black candlestick which reflects the current trend;
- a spinning top which we have already mentioned above;
- a large green or white candlestick confirming a change in the trend.
The Evening Star is a mirror variation of the Morning Star. Therefore, it predicts a bearish reversal.
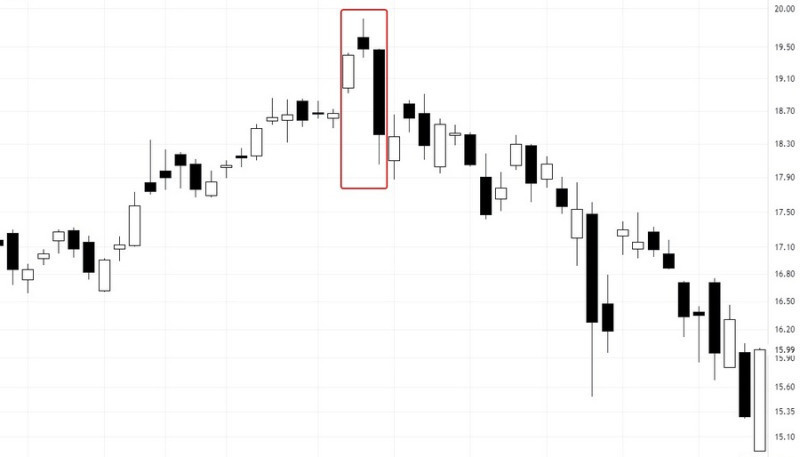
2. Three Black Crows is a formation consisting of a set of falling (black or red) candlesticks resembling a ladder. That is, the opening price is located at the level of the central part of the previous candlestick, and the closing price is found below it.
The first candlestick is usually smaller than the other two and is considered a reversal pattern, and the remaining ones confirm the new dynamics. This rule only works if the pattern appears at the peak of a bullish trend.
If it occurs in the middle of a trend or during a flat movement, the current market trend is likely to persist.
The opposite pattern is represented by Three White Soldiers. Here we are talking about bullish candlesticks.
3. The Abandoned Child is a reversal formation which includes a Doji. This pattern is found between the two candlesticks of different directions. The first one confirms the previous trend, while the second one confirms the opposite trend.
As a rule, all Japanese candlesticks are separated from each other by a price gap.
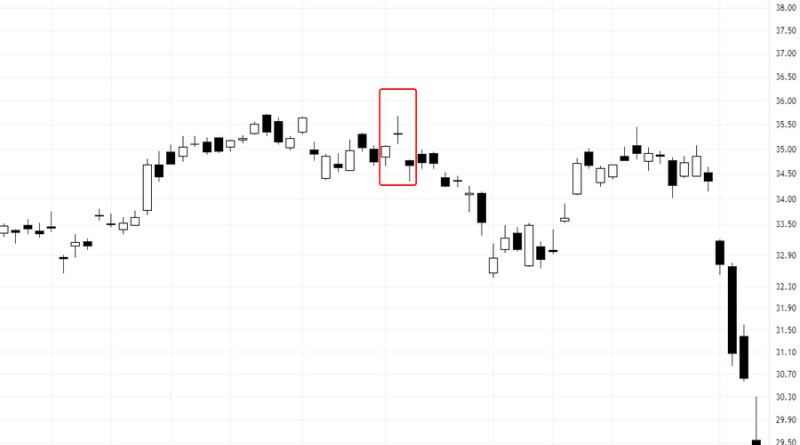
4. The Tasuki Gap appears quite rarely on the charts and warns of the continuation of the trend. Visually, it consists of three candlesticks: the first and the second confirm the trend, while the third one has an opposite direction.
Between the first and second candlesticks, there is a price gap. The third element brings the price back to its previous value that was posted before the gap.
How to read other formations
Before reading the candlesticks in the stock market, a trader should know how to recognize at least the basic patterns. At the same time, the maximum number of elements in one pattern is not limited to three, because there are more complex variants.
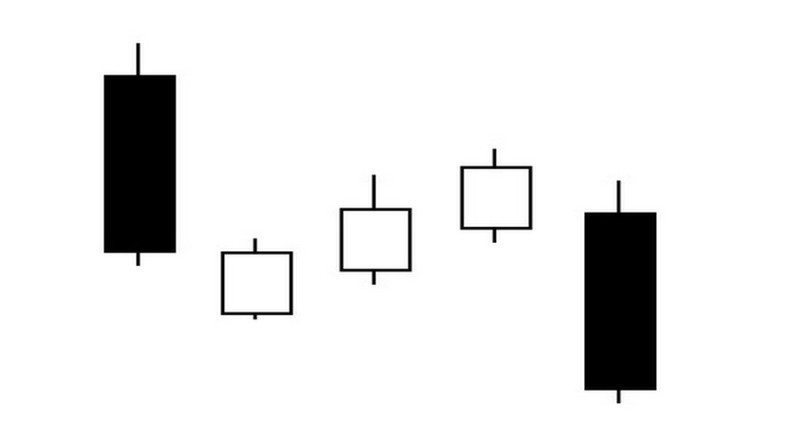
For example, the Triple Line Strike pattern consists of four elements, and the Hold of the Tatami pattern can contain five or more elements.
The latter is shown in the screenshot below. These are several short central candlesticks with short shadows, which are kind of squeezed on both sides by elements of the opposite color.
The color of the "clip" determines whether the formation is bullish or bearish. There is a price gap between the first and the second element, while the second and the third candlesticks overlap it.
All of the above-mentioned patterns are just a small part of the existing formations. But you don’t have to use all the possible variants in your trading. It can be impossible to identify them without the use of indicators.
Experts advise traders to choose and read several variants, which have proven to be effective when trading on the exchange. You should rely on the price history to test these patterns.
Pros and cons
If you decided to use Japanese candlesticks in stock trading, keep in mind the following advantages that can benefit your trading process:
- No flipping or lagging in the candlestick analysis. This allows traders to catch the best opportunities to enter the market;
- These charts are highly informative and easy to read compared to other graphs;
- Candlesticks are reliable. They have been around for centuries and have not lost their relevance;
- Compatible with other indicators. Japanese candlesticks can and should be used with additional tools such as Support and Resistance levels, the RSI, and others;
- They allow you to see the current trend and predict its future trajectory.
How to read candlesticks chart, another point in favor of candlesticks is that they can be applied to any asset. You can use them when trading Forex, stocks, or cryptocurrencies.
The frequency of patterns on the chart may vary depending on the asset. For example, some formations may appear rarely or may not appear at all on the charts of assets with low volatility.
Conversely, assets with high volatility will create patterns more often.
In addition, some patterns imply the presence of price gaps that mainly occur amid important news or after a break in trading.
Forex trading is available 24 hours a day, five days a week. Therefore, some currencies would hardly form any gaps.
The same chart is used to trade futures. Cryptocurrency exchanges operate 24/7, that is, without any breaks at all.
By contrast, gaps are more often observed on the stock exchange because the stock market operates for certain hours a day. This means that there will be more signals on these platforms than on others.
But at the same time, Japanese candlesticks cannot guarantee you profit. Firstly, they can be inaccurate, and secondly, a lot depends on the skill and experience of the trader.
A trader should know how to read patterns and make quick decisions.
Disadvantages include the following:
- The risk of false signals. The fact is that the charts are constantly updated, and sometimes an incomplete pattern is replaced by another one;
- Different perceptions of the chart. If a user is looking for a pattern without any confirmations, he/she may miss some of them or misinterpret the received signals;
- The need to take into account the context of the patterns. For example, reversal patterns are reliable only when they appear at the end of the existing trend;
- The patterns are used in different time frames. When using the M5 time interval or lower, traders face the influence of market noise. In addition, gaps can hardly be identified on such charts.
Recommendations
All the discussed patterns show traders the best points for entering the stock market. Each model signals the continuation of the current trend or its reversal. With this in mind, traders make a decision to enter.
Consider the following tips to read and use the patterns correctly:
1. The reliability of the signals decreases on lower time frames. The M1-M30 charts tend to show market noise the most. The H4-D1 time periods are considered optimal;
2. If you want to predict long-term trends, it is better to choose a weekly period;
3. Signals are not always clear. For example, sometimes the current trend persists even after a reversal signal.
This is due to the fact that market makers have a great influence on the market situation. When they come into play, the price may start moving contrary to the forecast;
4. The identified patterns need to be confirmed with the help of additional tools (MACD, RSI, trendlines).
Scalpers who use short time frames should switch to higher ones in order to make sure that the candlestick pattern is correctly identified;
5. Patterns containing gaps are considered more reliable. Patterns formed near the important price zones, such as support and resistance levels, can also be trusted;
6. Any formation found must be confirmed. So, if we are talking about a bearish pattern, a falling candlestick should appear on the chart after its formation;
7. Best of all, the potential of candlesticks is revealed on the D1 and W1 charts. Gaps are better identified on these charts which increases the reliability of signals;
8.You should look for patterns in trending markets. Otherwise, the signals may be false;
9. Context matters. For example, if a Gravestone Doji appears at the peak of the bullish trend, this can be regarded as a reversal signal. However, if it appeared inside the trend, then the current dynamic is likely to continue;
10. Particular attention should be paid to patterns formed after the price gap. As practice shows, their efficiency is much higher, and the signals are more reliable.
Real-life examples
To demonstrate the process of trading on the stock exchange using candlestick patterns, we will give specific examples. We will use the Morning and Evening Star patterns.
The Morning Star forms around the lower end of a downward price swing. When the falling trend is trying to change its direction, the price rushes upwards and the candlestick is formed with a price gap.
To identify the pattern, it is necessary to check:
- The nearest support level;
- The size and direction of the candlesticks. The first candlestick should have a large body and short wicks. It should confirm the current trend. The second element appears after a gap and should be smaller in size;
- The third candlestick also opens with a gap and should be of a bullish nature.
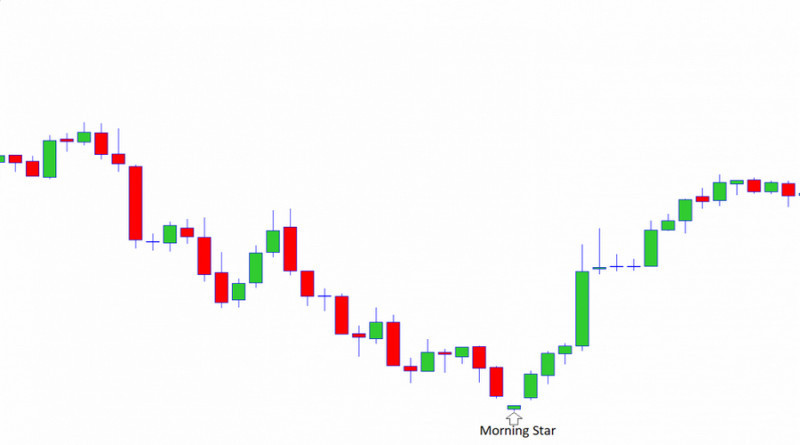
When all conditions are met, you can open a trade to buy the asset on the exchange. Enter the market after the formation of the third candlesticks, i.e. when the entire pattern is complete.
If a position is opened earlier, the risks will be very high. The best way is to open a trade at the opening price of the candlestick that follows the pattern.
It is advisable to set a stop-loss order at the low of the pattern to protect yourself against losses in case the signal is false.
If the price movement develops in accordance with the forecast, you can move the Stop Loss to the entry point.
Take Profit may be set near the resistance line.
Now let’s consider the Evening Star. As we have already mentioned above, it is formed at the top of an ascending trend.
After selecting the time frame, you should check that all the conditions that apply to this pattern are met:
- It is formed near the resistance level;
- The first candlestick shows the current downtrend, while the second one (bullish or bearish) opens with a gap. The third candlestick is opposite to the trend.
The best point to set a stop-loss order is at the high of the Evening Star pattern. Set a take-profit order at the support level.
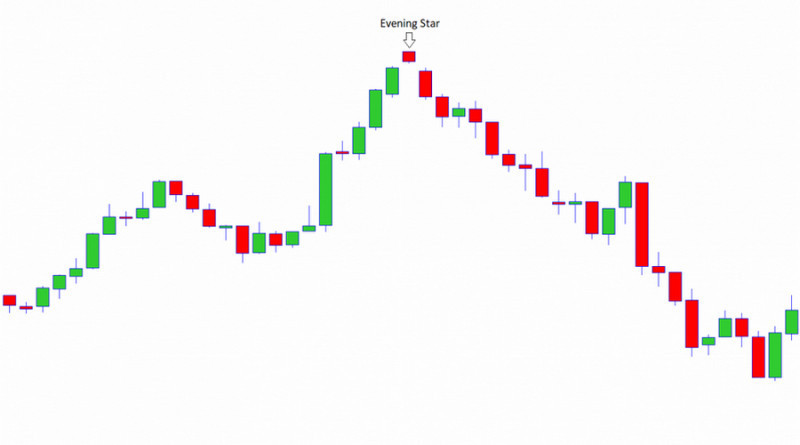
As in the case of the Morning Star, the entry is made after the last candlestick is formed. In this case, you should open a sell position because the price will fall even lower.
Enter the market at the opening price of the candle coming after the pattern.
As an alternative to support and resistance levels, you can use the Moving Average in both cases.
Signals generated by the Star pattern can be used when trading stocks, stock indices, currencies (fiat and digital), and commodities.
If you trade on a stock exchange, it is very likely that you won’t find many Star patterns within a trading session. In order to get more trading opportunities and receive more signals, it is necessary to identify other patterns.
Another common formation is the Hammer. Let's consider ways to trade using the hanged and inverted variants.
The first one is formed amid a prolonged upward price movement. The color of the central candlestick does not matter, the main thing is that the bottom wick is high and the body is small.
The reversal is confirmed by the element which follows the pattern: it must be red or black. Besides, the closing price of the second candlestick must be located below the central part of the pattern.
In this case, you can take the following steps:
- Open a short position;
- Set the Stop Loss beyond the current high;
- Set the Take Profit at the support level.
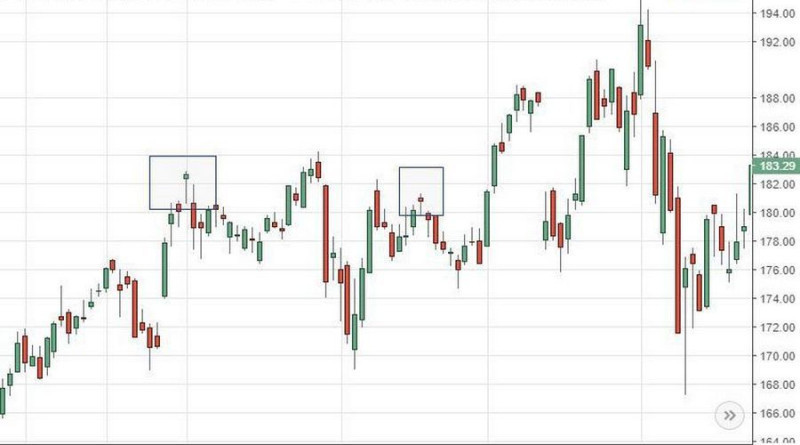
The algorithm is the same with an Inverted Hammer:
- Look for the pattern at the bottom of the downtrend. The candlestick must have a small body and a high upper shadow;
- Wait for confirmation in the form of a bullish candlestick. Its closing price must be above the body of the pattern;
- Open a buy position;
- Set the Stop Loss below the low of the pattern and place the Take Profit at the resistance level.
To sum up, the inverted version of the hammer is found at the end of the bearish trend. Both patterns mean a reversal but can also predict a correction.
The Hammer pattern can also be used for trading different assets. It is better to combine this pattern with other indicators to avoid big losses.
How to read candlesticks chart using indicators
Reading charts on the stock exchange can be a very time-consuming process. Traders need to be confident in their knowledge and skills to be successful in it.
It is essential to consider what the pattern looks like, when it is formed and when is the best moment to enter the market. By missing an important candlestick, a trader risks losing a good opportunity and can even suffer losses.
Besides, the whole process requires time. A trader needs to monitor the market, spot the pattern, check the signal, and only then open a trade.
To make the best out of chart trading, you can utilize indicators. These are specially designed algorithms that will take over the function of finding candlestick patterns.
The user will receive a notification that a pattern has been found and, based on this information, will make a decision to open a position. Moreover, quite often, indicators suggest the direction of the trade. In other words, they advise you on whether to buy or sell an asset.
Based on the situation on the stock exchange, a trader decides when to close a position.
Let's talk about some indicators that will help a trader with reading charts.
1. Pattern Graphix is a plugin suitable for MetaTrader platforms. It is a free expert advisor.
To use Pattern Graphix in trading, follow this algorithm:
- install the plugin on your device. In the Installation folder, select MetaTrader;
- allow DLL import by checking the box next to the corresponding line in the settings panel;
- open the indicator. To do this, you should first open the chart of the selected asset, and then drag the algorithm to it using the Navigator.
After the installation process is completed, you need to configure the Pattern Graphix settings in the corresponding window. With their help, a trader can:
- select patterns that the algorithm needs to recognize. The list includes reversal and continuation patterns, lines and levels (Support and Resistance, trend channels, Fibonacci levels), and candlestick patterns;
- change the color of the text, patterns, grids, and so on;
- enable or disable alerts. Information can be received by email, in the form of pop-up messages or push notifications;
2. The Candlestick Pattern Indicator, which also fully automates the process of pattern identification, does not require a trader to read it. Unlike the previous trading assistant, it works exclusively with Japanese candlesticks charts.
The program recognizes more than 30 patterns, and this list can be adjusted. You can also configure the search for a specific group of formations, for example, strong reversals.
When the scan is completed, the user will receive a notification, and the name of the pattern will appear on the chart, indicating the direction of the trade.
The Candlestick Pattern Indicator is also not built into the MetaTrader platform. You will first need to install it on your device and then paste the copied files into the Indicators section of the trading platform;
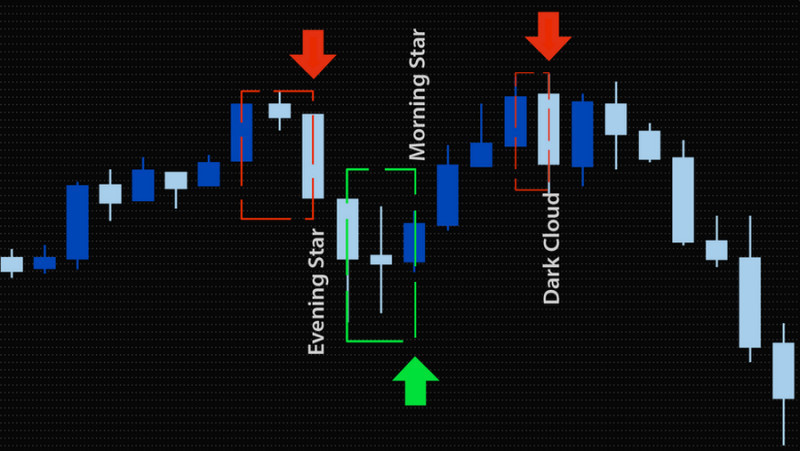
3. Japan is an algorithm that is able to detect the Hammer, Engulfing, and Doji patterns. When you hover over the found pattern, the system gives its detailed description. The direction of the position is indicated by arrows of different colors;
4. The Bheurekso pattern Indicator can read patterns and identify their names. It also indicates the direction of the recommended position. As practice shows, most often this algorithm is used on large time frames as a confirming tool;
5. Pattern Options: the principle of operation of this indicator is similar to the previous ones. The settings make it possible to search not only for specific formations but also for groups of patterns (strong or weak);
6. Pattern Recognition Master: in the settings of this indicator, you can select a maximum of 10 patterns. Also, users can change the color scheme and set a certain type of alerts.
On the chart, each pattern is indicated by a letter code and a detailed description presented in the upper left corner of the window.
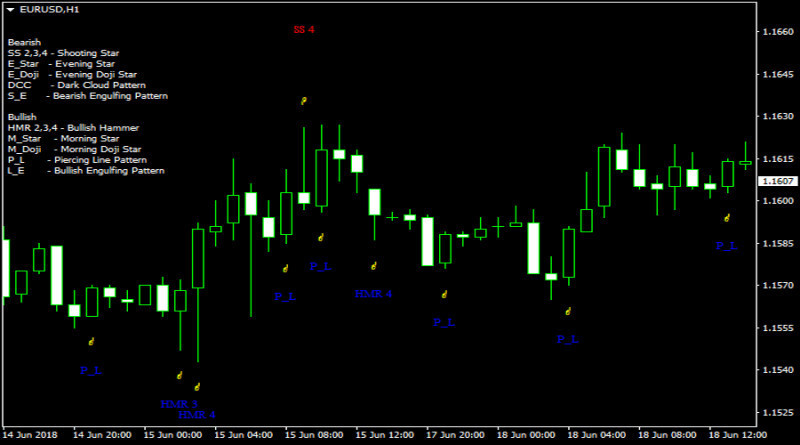
In addition, you can use HartF to read Engulfings and PinBar Detector to identify pin bars, and so on. All algorithms are first downloaded and then added to trading platforms.
If you use other platforms than MetaTrader to trade on the stock exchange, make sure that it is technically possible to install additional indicators there. As a rule, you can find this information in a guide to the platform.
Conclusion
In this article “How to read candlesticks chart”, you have learned how to read candlestick charts when trading stocks. Novice traders may find it difficult at first but as they enhance their skills, the process gets easier.
The key advice here is to avoid using several patterns at once, especially at the start of your trading journey.
If you are still new to trading and struggling to read charts, follow these simple steps:
- Study the most popular and common patterns, paying attention to their name and characteristics. This way, you will remember them better;
- Choose one or two types you find the easiest to understand. This will allow you to find a particular algorithm for reading charts;
- Test your skills and the accuracy of signals using the historic price data. This way, you will see whether you have correctly identified the pattern and what trading opportunities it gives you;
- Start trading live in the stock market with a small lot. Analyze your trades and mistakes;
- If trading with candlesticks seems easy but you get very few signals, just add some new patterns to your chart;
- Use indicators if you don’t have time to look for the patterns yourself. In this case, algorithms will analyze the chart for you.
We would like to mention that even professional traders with vast experience in trading stocks and using patterns do not get profit all the time. It is ok to have losing trades. Just make sure that losses are balanced with profits.
You may also like
How to read stock charts
How to read investment charts
How to read a stock action
How to read graphs
Best indicators for 1 minute chart
Japanese candlestick chart
Candlestick chart


 Back to articles


