Actual patterns
Patterns are graphical models which are formed in the chart by the price. According to one of the technical analysis postulates, history (price movement) repeats itself. It means that the price movements are often similar in the same situations which makes it possible to predict the further development of the situation with a high probability.
Actual Patterns
- All
- Double Top
- Flag
- Head and Shoulders
- Pennant
- Rectangle
- Triangle
- Triple top
- All
- #AAPL
- #AMZN
- #Bitcoin
- #EBAY
- #FB
- #GOOG
- #INTC
- #KO
- #MA
- #MCD
- #MSFT
- #NTDOY
- #PEP
- #TSLA
- #TWTR
- AUDCAD
- AUDCHF
- AUDJPY
- AUDUSD
- EURCAD
- EURCHF
- EURGBP
- EURJPY
- EURNZD
- EURRUB
- EURUSD
- GBPAUD
- GBPCHF
- GBPJPY
- GBPUSD
- GOLD
- NZDCAD
- NZDCHF
- NZDJPY
- NZDUSD
- SILVER
- USDCAD
- USDCHF
- USDJPY
- USDRUB
- All
- M5
- M15
- M30
- H1
- D1
- All
- Buy
- Sale
- All
- 1
- 2
- 3
- 4
- 5
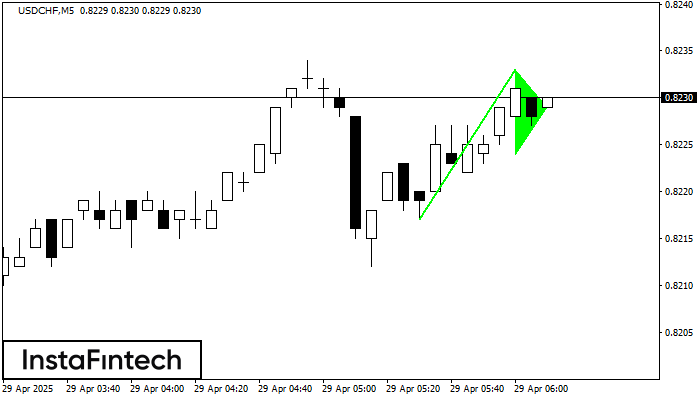
M5 চার্টে, USDCHF-এ বুলিশ পেন্যান্ট প্যাটার্নটি গঠিত হয়েছে। এটি এক ধরনের ধারাবাহিকতার প্যাটার্ন। অনুমিতভাবে, যদি মূল্য পেন্যান্টের সর্বোচ্চ 0.8233 -এর উপরে স্থির হয়, তাহলে আরও ঊর্ধ্বমুখী প্রবণতার সম্ভবনা রয়েছে।
M5 এবং M15 টাইম ফ্রেমে আরও ভুল এন্ট্রি পয়েন্ট থাকতে পারে।
Open chart in a new window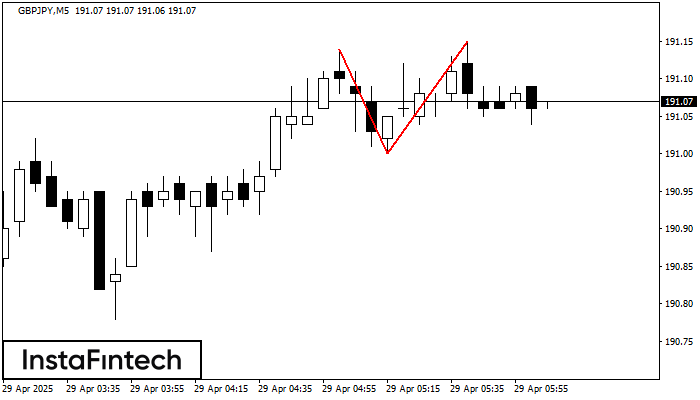
M5 চার্টে, GBPJPY-এর ডাবল টপ প্যাটার্নটি গঠিত হয়েছে। এটি এই ইঙ্গিত দেয় যে চলমান প্রবণতা ঊর্ধ্বমুখী থেকে নিম্নমুখীতে পরিবর্তিত হয়েছে। সম্ভবত, যদি 191.00 প্যাটার্নের ভিত্তিটি ব্রেক করা হয়, তাহলে নিম্নমুখী
M5 এবং M15 টাইম ফ্রেমে আরও ভুল এন্ট্রি পয়েন্ট থাকতে পারে।
Open chart in a new window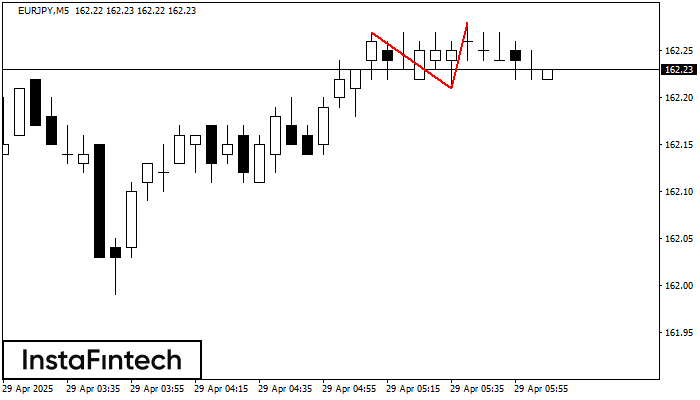
M5 চার্টে, EURJPY-এর ডাবল টপ রিভার্সাল বা বিপরীতমুখী প্যাটার্ন গঠিত হয়েছে। বৈশিষ্ট্য: উপরের সীমানা 162.27; নীচের সীমানা 162.21; প্যাটার্নের প্রস্থ হল 7 পয়েন্ট। 162.21 162.06 স্তরের দিকে সম্ভাব্য মুভমেন্টের সাথে
M5 এবং M15 টাইম ফ্রেমে আরও ভুল এন্ট্রি পয়েন্ট থাকতে পারে।
Open chart in a new window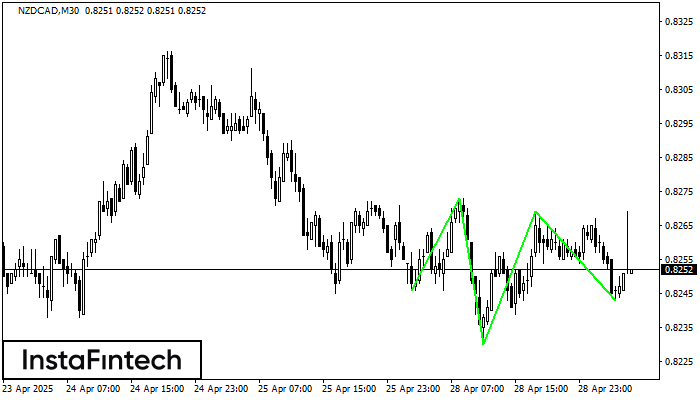
M30 চার্ট অনুযায়ী, NZDCAD-এর ইনভার্স হেড অ্যান্ড শোল্ডার্স প্যাটার্ন গঠিত হয়েছে। হেডের টপ 0.8269 -এ নির্ধারণ করা হয়েছে এবং নেকের মিডিয়ান লাইনটি 0.8230/0.8243-এ পাওয়া গিয়েছে। ইনভার্স হেড অ্যান্ড শোল্ডার্স প্যাটার্নের
Open chart in a new window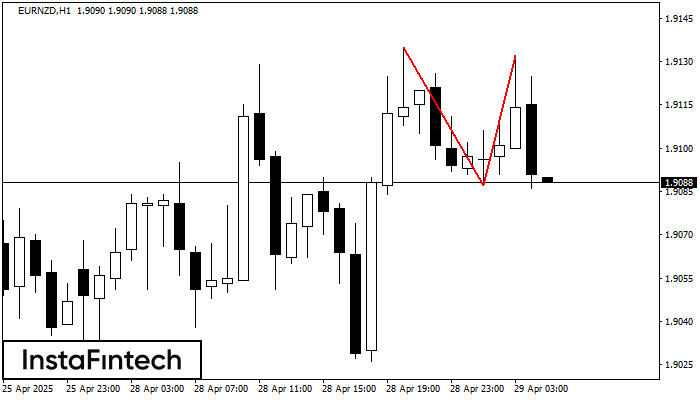
H1 চার্টে, EURNZD-এর ডাবল টপ প্যাটার্নটি গঠিত হয়েছে। এটি এই ইঙ্গিত দেয় যে চলমান প্রবণতা ঊর্ধ্বমুখী থেকে নিম্নমুখীতে পরিবর্তিত হয়েছে। সম্ভবত, যদি 1.9087 প্যাটার্নের ভিত্তিটি ব্রেক করা হয়, তাহলে নিম্নমুখী
Open chart in a new window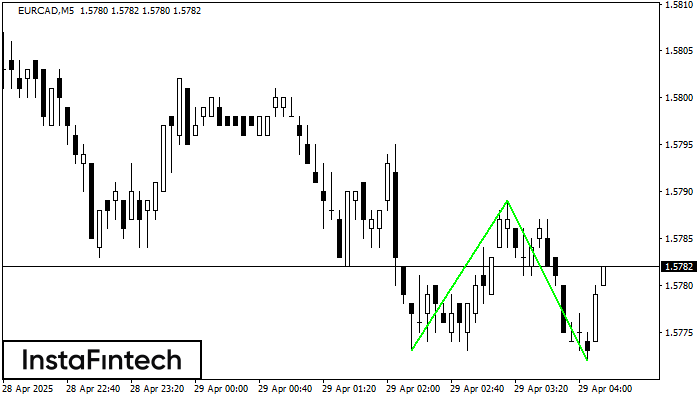
M5 চার্টে, EURCAD-এর ডাবল বটম প্যাটার্নটি গঠিত হয়েছে। বৈশিষ্ট্য: সাপোর্ট স্তর হচ্ছে 1.5773; রেজিস্ট্যান্স স্তর হচ্ছে 1.5789; প্যাটার্নের প্রস্থ হচ্ছে 16 পয়েন্ট। রেজিস্ট্যান্স স্তর ভেদ করা হলে, 17 পয়েন্টের দূরত্বে
M5 এবং M15 টাইম ফ্রেমে আরও ভুল এন্ট্রি পয়েন্ট থাকতে পারে।
Open chart in a new window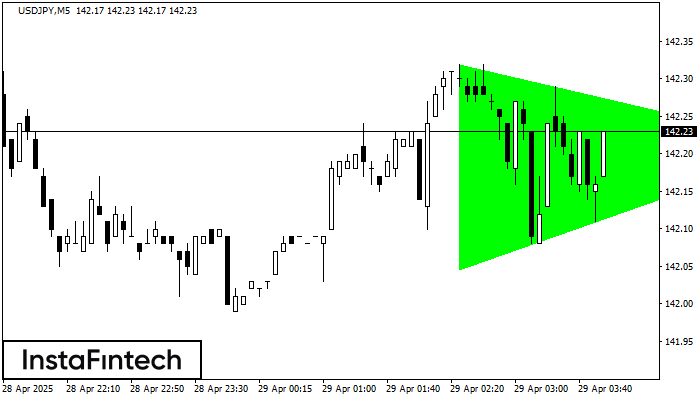
M5 চার্ট অনুযায়ী, USDJPY বুলিশ সিমেট্রিকাল ট্রায়াঙ্গেল প্যাটার্ন গঠন করেছে। বর্ণনা: এটি একটি ধারাবাহিক প্রবণতার প্যাটার্ন। 142.32 এবং 142.05 হল যথাক্রমে উপরের এবং নীচের সীমানার কোঅর্ডিনেট। চার্টে প্যাটার্নের প্রস্থ
M5 এবং M15 টাইম ফ্রেমে আরও ভুল এন্ট্রি পয়েন্ট থাকতে পারে।
Open chart in a new window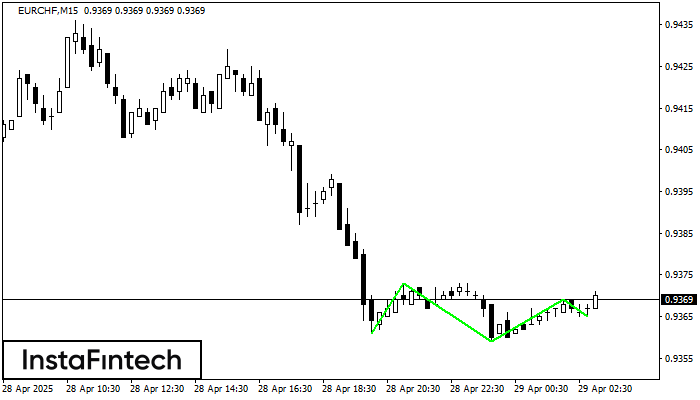
M15 চার্টে EURCHF-এর ট্রিপল বটম প্যাটার্নটি গঠিত হয়েছে। এই প্যাটার্নের নিম্নলিখিত বৈশিষ্ট্য রয়েছে: রেজিস্ট্যান্স স্তর 0.9373/0.9369; সাপোর্ট স্তর 0.9361/0.9365; প্রস্থ হল 12 পয়েন্ট। 0.9373-এর রেজিস্ট্যান্স স্তর ব্রেক করা ঘটলে, মূল্য
M5 এবং M15 টাইম ফ্রেমে আরও ভুল এন্ট্রি পয়েন্ট থাকতে পারে।
Open chart in a new window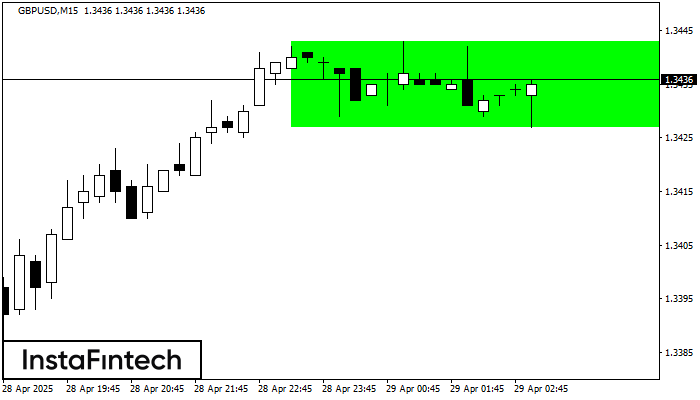
M15 চার্ট অনুসারে, GBPUSD বুলিশ রেক্ট্যাঙ্গেল গঠন করেছে যা চলমান প্রবণতার ধারাবাহিকতার প্যাটার্ন। প্যাটার্নটি নিম্নলিখিত সীমানার মধ্যে রয়েছে: নীচের সীমানা 1.3427 – 1.3427 এবং উপরের সীমানা 1.3443 – 1.3443৷ উপরের
M5 এবং M15 টাইম ফ্রেমে আরও ভুল এন্ট্রি পয়েন্ট থাকতে পারে।
Open chart in a new window