EUR/USD 5-Minute Analysis
The EUR/USD currency pair exhibited low volatility on Wednesday and has not yet determined its direction of movement. We are not considering the fluctuations that occurred following the announcement of the Federal Reserve meeting results, as we believe the market needs time to process the information and adjust the pair's rate. Conclusions can be drawn no earlier than mid-Thursday when European traders will also react to the Fed meeting results. On Wednesday, there were no macroeconomic reports in either the EU or the US, leaving the market with little to react to. As a result, it began to sift through the continuous flow of information from Donald Trump. The days when Trump's statements could trigger a 100-pip movement are long gone. The market is now very cautious regarding the US President's remarks, given his track record of failing to fulfill several election promises.
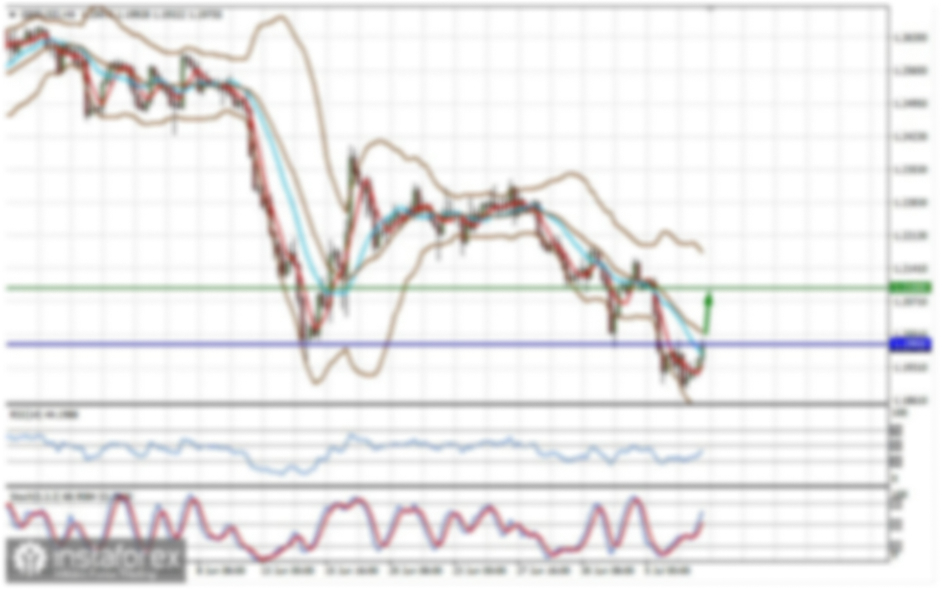
The technical outlook had already shifted prior to the Fed meeting. The price broke through the ascending trendline but quickly rebounded upward. However, this breakout suggests that the price is poised for another decline. While it may not necessarily lead to a continuation of the four-month downtrend, some decline seems likely. Nonetheless, it is premature to jump to conclusions. Today marks the European Central Bank meeting, which may result in further changes to the technical picture. Additionally, we should await the response of European traders to the Fed meeting.
There were no significant trading signals to highlight from Wednesday, as none were generated. During the European trading session, the price approached the Kijun-sen line but failed to fully engage with it, even with a slight margin.
COT Report
The latest Commitments of Traders (COT) report, dated January 21, shows that the net position of non-commercial traders has remained bullish for quite some time. However, bears have now taken the lead. Two months ago, there was a significant increase in the number of short positions held by professional traders, causing the net position to turn negative for the first time in a long while. This indicates that the European currency is now being sold more frequently than it is being bought.
We do not see any fundamental factors that would strengthen the European currency. The recent growth of the euro on the weekly timeframe appears to be a simple retracement. While the pair may experience a correction for a few more weeks, the long-term downward trend that has persisted for 16 years is unlikely to be reversed.
At this time, the red and blue lines have crossed, indicating a bearish trend in the market. During the last reporting week, the number of long positions in the "Non-commercial" category increased by 4,900, while the number of short positions rose by 6,900. As a result, the net position decreased by another 2,000 contracts.
EUR/USD 1-Hour Analysis
On the hourly timeframe, the pair continues its upward trend, which is corrective. We believe that a decline will likely resume in the medium term. The Fed may cut rates only 1-2 times in 2025, reflecting a more hawkish stance than the market had anticipated. This factor, among others, could support the American dollar going forward. The price has broken the trendline and now needs to overcome the Senkou Span B line before we can confirm a new downward trend on the hourly timeframe.
For trading on January 30, we highlight the following key levels: 1.0124, 1.0195, 1.0269, 1.0340-1.0366, 1.0461, 1.0524, 1.0585, 1.0658-1.0669, 1.0757, 1.0797, and 1.0843, along with the Senkou Span B line at 1.0318 and the Kijun-sen line at 1.0453. Please note that the Ichimoku indicator lines may shift throughout the day, which should be taken into account when identifying trading signals. Remember to place a Stop Loss order at breakeven if the price has moved 15 pips in your favor, as this will help protect against potential losses if the signal turns out to be false.
On Thursday, the European Union will release the results of the ECB meeting, and Christine Lagarde will speak. Additionally, Germany, the EU, and the US will publish their fourth-quarter GDP reports. While these reports may be overshadowed by the ECB and Fed meetings, they will still provide valuable insights into potential changes in economic growth for both the EU and the US.
Illustration Explanations:
- Support and Resistance Levels (thick red lines): Thick red lines indicate where movement may come to an end. Please note that these lines are not sources of trading signals.
- Kijun-sen and Senkou Span B Lines: Ichimoku indicator lines transferred from the 4-hour timeframe to the hourly timeframe. These are strong lines.
- Extreme Levels (thin red lines): Thin red lines where the price has previously bounced. These serve as sources of trading signals.
- Yellow Lines: Trendlines, trend channels, or any other technical patterns.
- Indicator 1 on COT Charts: Represents the net position size for each category of traders.