was formed on 02.04 at 09:13:40 (UTC+0)
signal strength 4 of 5
signal strength 4 of 5
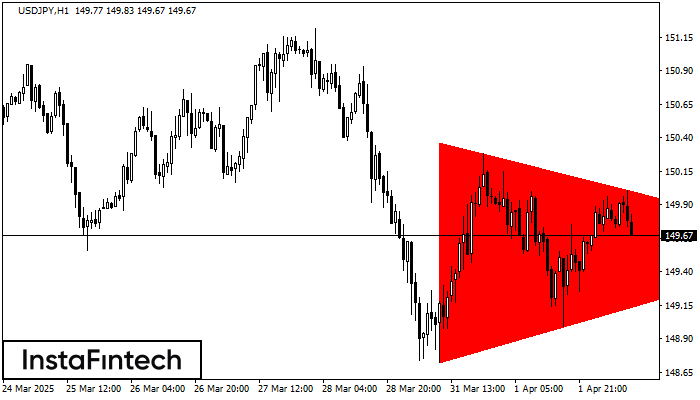
According to the chart of H1, USDJPY formed the Bearish Symmetrical Triangle pattern. Trading recommendations: A breach of the lower border 148.72 is likely to encourage a continuation of the downward trend.
Figure
- All
- Double Top
- Flag
- Head and Shoulders
- Pennant
- Rectangle
- Triangle
- Triple top
Instrument
- All
- #AAPL
- #AMZN
- #Bitcoin
- #EBAY
- #FB
- #GOOG
- #INTC
- #KO
- #MA
- #MCD
- #MSFT
- #NTDOY
- #PEP
- #TSLA
- #TWTR
- AUDCAD
- AUDCHF
- AUDJPY
- AUDUSD
- EURCAD
- EURCHF
- EURGBP
- EURJPY
- EURNZD
- EURRUB
- EURUSD
- GBPAUD
- GBPCHF
- GBPJPY
- GBPUSD
- GOLD
- NZDCAD
- NZDCHF
- NZDJPY
- NZDUSD
- SILVER
- USDCAD
- USDCHF
- USDJPY
- USDRUB
Timeframe
- All
- M5
- M15
- M30
- H1
- D1
Trend
- All
- Buy
- Sale
Signal Strength
- All
- 1
- 2
- 3
- 4
- 5
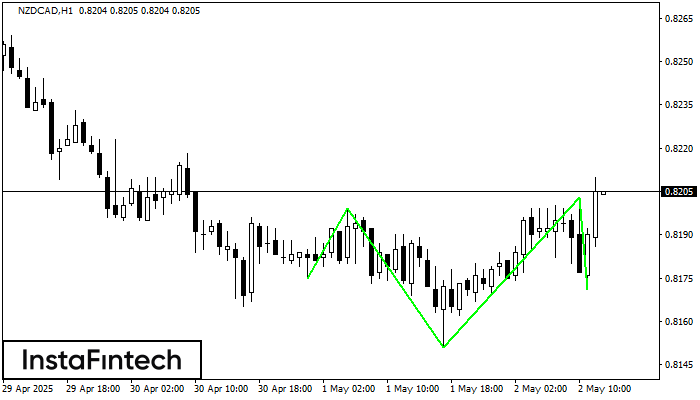
According to the chart of H1, NZDCAD produced the pattern termed the Inverse Head and Shoulder. The Head is fixed at 0.8151 while the median line of the Neck
Open chart in a new window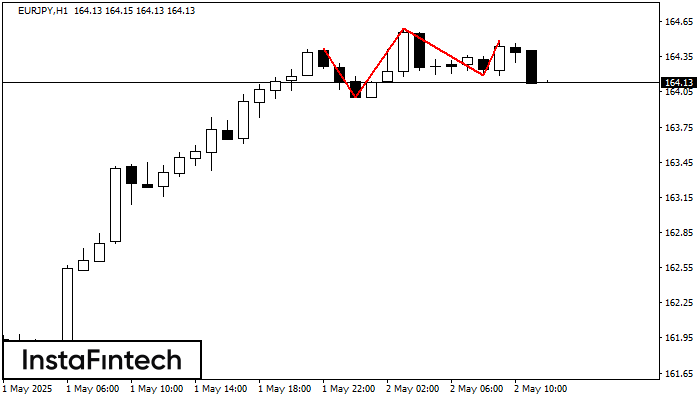
The Triple Top pattern has formed on the chart of the EURJPY H1 trading instrument. It is a reversal pattern featuring the following characteristics: resistance level -7, support level -19
Open chart in a new window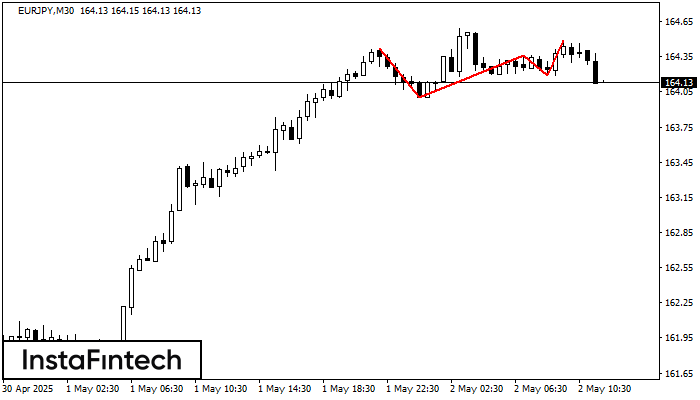
The Triple Top pattern has formed on the chart of the EURJPY M30 trading instrument. It is a reversal pattern featuring the following characteristics: resistance level -7, support level -19
Open chart in a new window